Content Marketing ROI: Formula, Examples, and a Template
Calculate content marketing ROI with full costs, contribution margin, and an attribution rule. Use worked examples and a copyable reporting template.

Content marketing ROI compares the financial return credited to a content investment with the full cost of that investment. A useful calculation makes the cost, revenue basis, attribution rule, and reporting period explicit.
For a profitability decision, use the contribution from the attributed sales after the relevant variable costs, then subtract the content investment. Revenue alone can make a modest return look much larger.
This guide provides worked arithmetic, a copyable worksheet, and a practical measurement process. All worked figures below are illustrative inputs, not results from Rankauto or a customer.
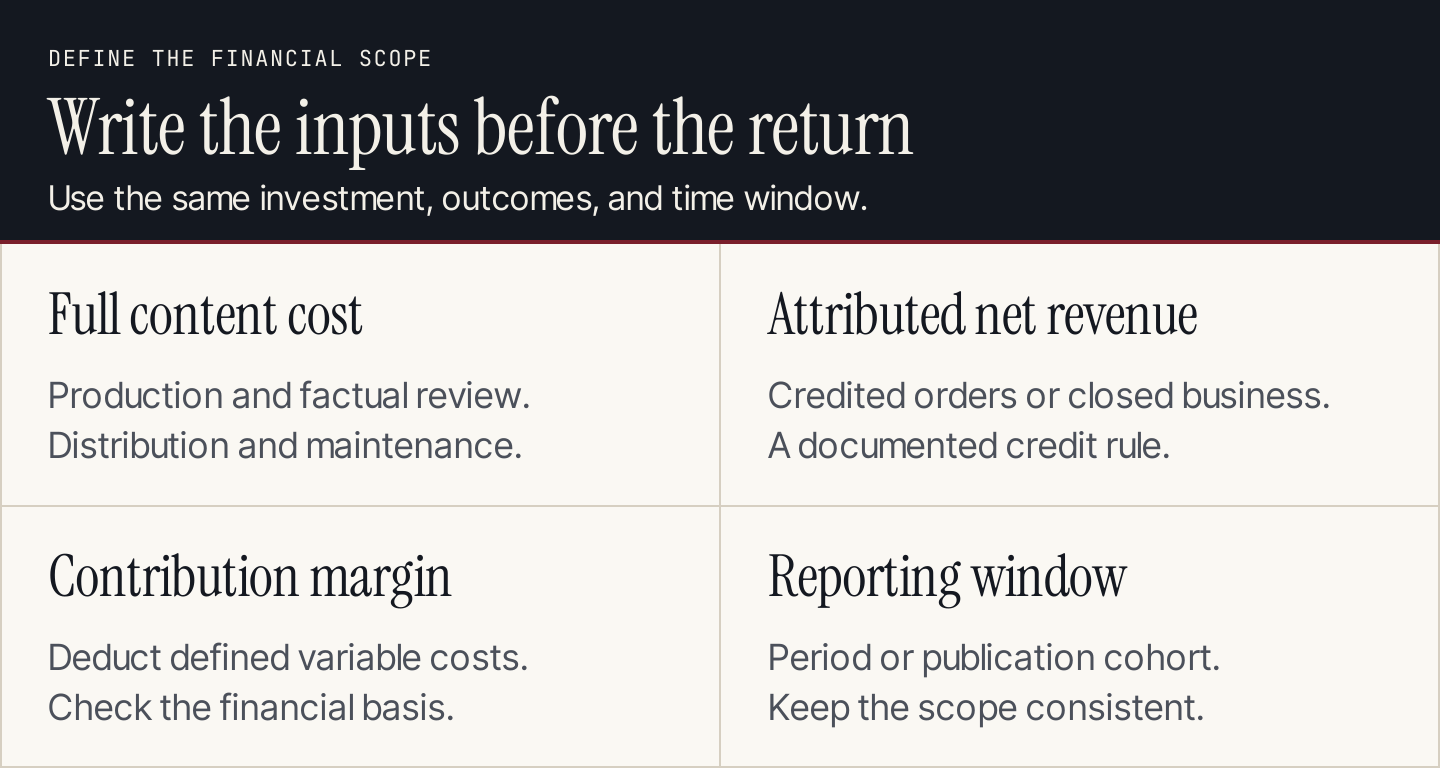
Define the inputs and their scope before interpreting a return percentage.
The content marketing ROI formula
For the contribution-based calculation used in this guide:
Attributed contribution = Attributed net revenue × Contribution margin

Content ROI (%) =
  (Attributed contribution - Full content cost)
  ÷ Full content cost × 100
Contribution margin here means the share of net revenue remaining after the variable costs you define for fulfilling those sales, before the content investment. Agree on that definition with the person responsible for your financial reporting. This is a management calculation for evaluating content; it isn't the company's overall net profit margin.
If reliable contribution data isn't available, you can report revenue-based ROI, but label it explicitly:
Revenue-based ROI (%) =
  (Attributed net revenue - Full content cost)
  ÷ Full content cost × 100
That second calculation doesn't deduct the cost of supplying the product or service. It should not be described as profit-based return.
| Measure | Calculation | What it tells you |
|---|---|---|
| Contribution-based content ROI | (Attributed contribution - content cost) / content cost | Return after the defined variable sales costs and content investment |
| Revenue-based content ROI | (Attributed net revenue - content cost) / content cost | Revenue relative to content cost, before fulfillment costs |
| Revenue-to-content-cost ratio | Attributed net revenue / content cost | Revenue dollars credited per content dollar |
| Cost per qualified inquiry | Content cost / qualified inquiries | Acquisition efficiency at a defined inquiry stage |
| Attributed pipeline | Value of credited open opportunities | Potential sales under a stated rule; not realized return |
Multiply the first two ratios by 100 to express them as percentages. A zero content cost makes those ROI formulas undefined; don't replace the denominator with an arbitrary value.
A worked example: why revenue and profit differ
Suppose a content program costs $3,000. Under the team's documented attribution rule, it receives credit for $12,000 in net revenue. The contribution margin, after the defined variable costs, is 40%.
| Input or result | Illustrative amount | Calculation |
|---|---|---|
| Full content cost | $3,000 | Cost worksheet below |
| Attributed net revenue | $12,000 | Credited orders, net of applicable discounts and refunds |
| Contribution margin | 40% | Agreed financial definition |
| Attributed contribution | $4,800 | $12,000 × 0.40 |
| Contribution after content cost | $1,800 | $4,800 - $3,000 |
| Contribution-based ROI | 60% | $1,800 / $3,000 × 100 |
| Revenue-based ROI | 300% | ($12,000 - $3,000) / $3,000 × 100 |
| Revenue-to-content-cost ratio | 4× | $12,000 / $3,000 |
The 60%, 300%, and 4× figures describe different things. Use the one that matches the decision, and show its definition. The same illustrative revenue doesn't establish that content caused $12,000 in additional sales.
For a store, check the coverage of the profit data before using it. Shopify's profit report documentation explains that product profit reporting depends on recorded item costs and that discounts and refunds affect reported margins. Product gross profit and the contribution definition used above are not automatically identical.
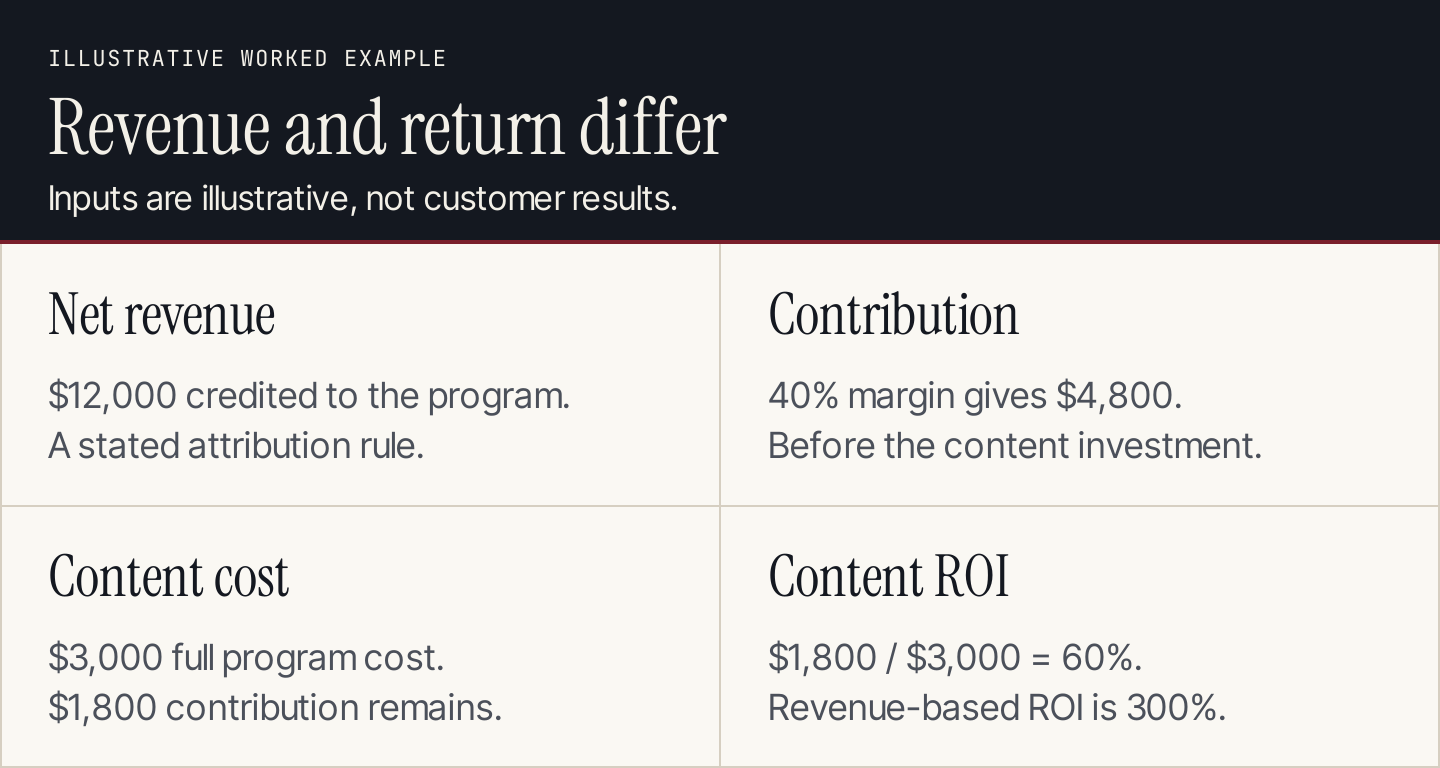
Illustrative calculation: the 60% return uses contribution after the defined variable costs, not gross revenue.
Count the full cost of content marketing
Include the work required to produce, release, distribute, and maintain the assets in the reporting scope. A writing invoice alone is usually incomplete.
| Cost category | Illustrative amount | What to include |
|---|---|---|
| Research and writing | $1,200 | Internal allocated time and external writing fees |
| Editing and factual review | $500 | Editorial and specialist review time |
| Interviews and evidence preparation | $300 | Preparation, interview, verification, permissions |
| Design and images | $300 | Original diagrams, approved assets, visual review |
| Distribution | $400 | Allocated promotion work and relevant campaign spend |
| Tools | $300 | The portion attributable to the measured program |
| Total | $3,000 | Sum of the included costs |
These inputs form the example, not a suggested market price. Use actual invoices and a consistent method for internal time. Don't count an employee's full salary again if an allocated labor cost already includes that work.
For shared software or research, document the allocation method. If several clients use a tool, assign only the relevant share to the content program. If an agency fee includes design and distribution, avoid adding the same included services again as separate expenses.
Include maintenance work when evaluating the ongoing program. A library can continue producing value, but keeping it accurate, accessible, and useful still has a cost.
Decide what revenue receives credit
Attribution assigns credit to interactions along a customer's path. Google Analytics describes attribution as a credit-assignment process and documents the models available in its attribution reports.
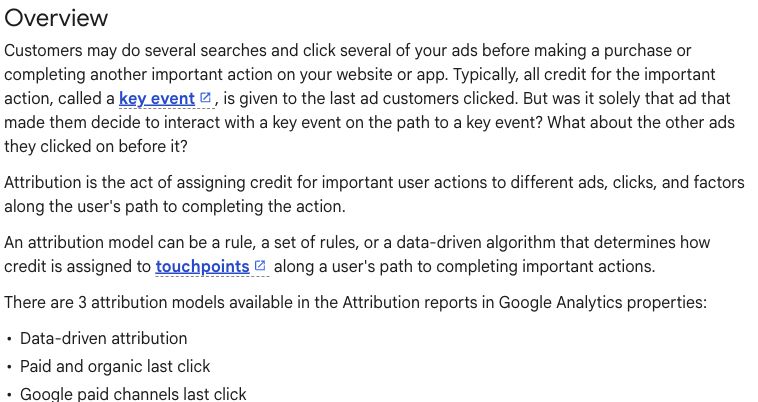
Google's documentation distinguishes attribution models that assign credit to interactions. Source: Google Analytics.
For your content report, write the rule in plain language. Define the included assets and interactions, the qualifying sale or customer action, the time window, and how shared credit is handled.
Common reporting choices answer different questions:
| Reporting question | What you examine | Main limitation |
|---|---|---|
| What brought a customer into the measured relationship? | First recorded qualifying interaction in your data | Earlier or untracked interactions may be missing |
| What interaction preceded the outcome under our rule? | The documented final qualifying interaction | Earlier content may have contributed |
| Which assets appeared in an observed journey? | Recorded content interactions before the outcome | Presence doesn't establish incremental impact |
| How does the platform allocate credit? | The selected model and its eligible interactions | Model results depend on definitions, settings, and observed data |
These are analytical questions, not a claim that every named approach is an available GA4 attribution model. Don't follow an old tutorial that assumes deprecated models still appear in the current interface.
Attribution is different from incrementality
Attribution helps you allocate credit within the observed journey. Incrementality asks what would have happened without the content or program.
An attributed sale may have happened anyway. A buyer may also have used content on another device, discussed it with a colleague, or encountered it in a place your system can't observe. Explain those limitations without treating every unmeasured interaction as hidden revenue.
When the decision justifies it, design a suitable comparison or experiment with someone qualified to assess the method. Keep the conclusion proportional to what that design establishes. An analytics attribution report by itself isn't your own controlled experiment of the content program.
Build a measurement route from asset to outcome
Give each asset an identifier
Use the same identifier in the production calendar, cost worksheet, and reporting notes. Record the live URL, publish date, format, intended audience, and role.
Group related assets when evaluating a program. A guide, a case study, and a checklist may work together over a long buying cycle. Trying to assign every sale to one paragraph can create precision the evidence doesn't support.
Track the appropriate customer action
For ecommerce, use validated order and revenue data, accounting for the defined treatment of discounts, refunds, taxes, and cancellations. For services, connect inquiries to qualified opportunities and closed business through the team's customer records.
Verify that the tracked event represents what its label promises. A form submission is not a qualified inquiry until the qualification conditions have been applied. A proposal value is not realized revenue.
Use your existing lead quality definition to keep qualification consistent. Record failures in the tracking route instead of interpreting missing data as zero activity.
Tag links that distribute the content
Google's campaign URL guidance explains how UTM parameters identify referring campaigns and where session campaign data appears in reporting. It also notes that parameter values are case-sensitive.
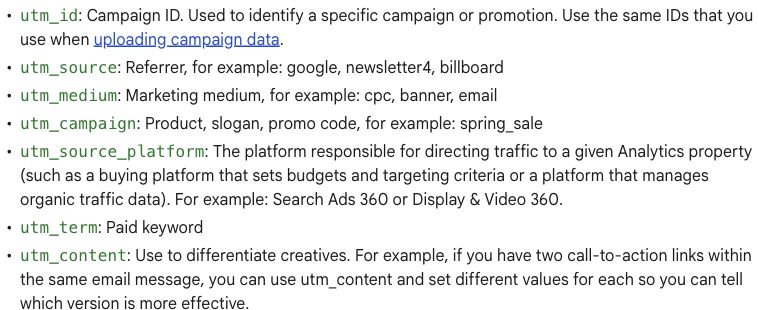
Google documents the campaign parameters used to distinguish referring links. Source: Google Analytics.
For an illustrative newsletter link, agree on consistent values for source, medium, campaign, and the particular link placement. Keep a small naming record so different team members don't create several names for the same campaign.
Test the link and the resulting report entry. Tagged traffic identifies a measured route; it doesn't turn every resulting sale into a proven incremental effect. Keep personally identifying customer information out of campaign labels and URLs.
Match costs and outcomes to the same scope
Choose whether you are evaluating a reporting period, an asset group, or a publication cohort. A cohort is a group defined by a common starting condition, such as guides first published in the same month.
For a monthly operations report, show current spending, outcomes under the stated rule, and material work still in progress. For an investment evaluation, follow the selected asset group over a defined window and include its relevant production and maintenance costs.
Don't compare one month's spending with lifetime revenue unless the report explicitly evaluates that lifetime investment and includes the full relevant cost. Don't present a recent piece as a failure solely because the normal buying cycle hasn't finished.
Use a consistent review window and preserve the original snapshot when definitions change. Then show the revised calculation separately with the reason. This is especially useful for agencies reporting on work that takes several months to turn into closed business.
Show how assumptions change the conclusion
Keep the example's $3,000 cost and 40% margin. Suppose three documented reporting scenarios credit different amounts of net revenue to the same program:
| Illustrative credited revenue | Contribution at 40% | Contribution-based ROI |
|---|---|---|
| $9,000 | $3,600 | 20% |
| $12,000 | $4,800 | 60% |
| $15,000 | $6,000 | 100% |
These are scenarios, not outputs from a tested attribution platform. They show why the credit rule matters. Don't choose the highest result simply because it makes the program look better.
The same example breaks even at $7,500 of attributed net revenue: $3,000 divided by 0.40. That calculation assumes the margin and included costs remain as defined. At $4,500 of revenue, contribution is $1,800 and ROI is -40%.
If the margin is uncertain, vary that assumption as well. Show which input drives the recommendation and what evidence would narrow the uncertainty.
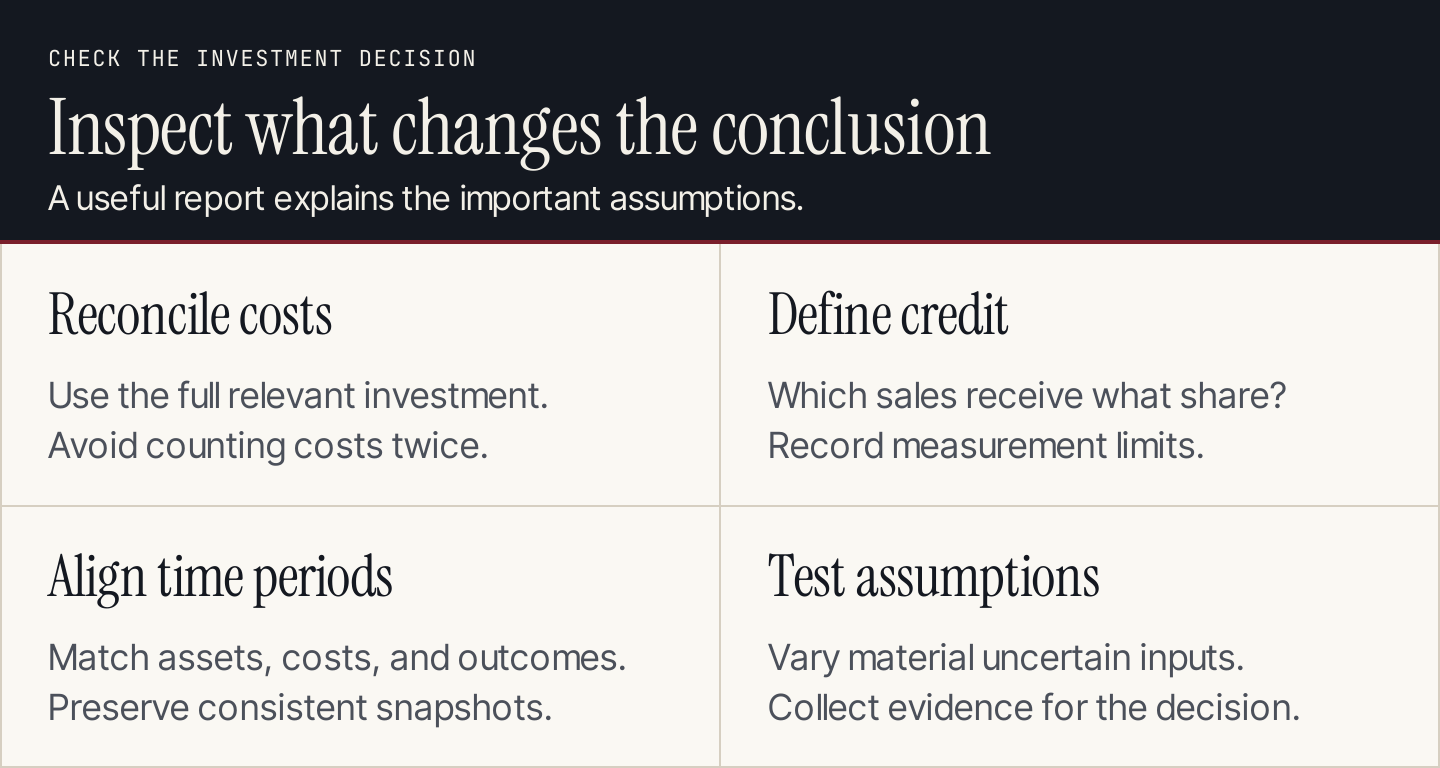
Review the assumptions that could change the investment decision, rather than presenting one unexplained percentage.
Copy this content ROI reporting template
| Field | What to record |
|---|---|
| Program and asset scope | Included identifiers, URLs, channels, and exclusions |
| Period or cohort | Publish window, outcome window, reporting date |
| Full content cost | Costs, allocation method, internal time basis, maintenance |
| Outcome evidence | Orders or closed business; system and reconciliation checks |
| Net revenue definition | Treatment of discounts, refunds, cancellations, taxes, and other exclusions |
| Attribution rule | Eligible interactions, credit allocation, time window, data limits |
| Contribution definition | Variable costs deducted; source of the margin |
| Calculation | Credited revenue, contribution, net contribution, ROI |
| Supporting measures | Qualified inquiries, task completion, or other role-specific progress |
| Sensitivity | Material alternative assumptions and their effect |
| Decision | Continue, improve, investigate, or stop; responsible owner |
| Next review | Date or trigger and the missing evidence to collect |
If the financial result isn't measurable yet, report the supported progress. For example, an illustrative $3,000 program with 25 qualified inquiries has a cost of $120 per qualified inquiry. That is an efficiency measure. A $50,000 open pipeline figure is potential business; neither number establishes realized ROI.
Use the calculation to choose the next action
When qualified traffic is low, inspect whether the content reaches the intended audience and is distributed through suitable routes. When readers arrive but don't take the expected action, review the answer, suitability, and next step. When sales occur but return remains weak, inspect costs, margins, and the credit rule before expanding production.
Compare consistent scopes and document other changes. More content isn't automatically the solution to a measurement problem or an offer that doesn't fit the audience.
Rankauto supports blog production by researching customer searches, writing and fact-checking articles in your brand voice, and adding images and SEO fields. The plan is $49 a month per website with 30 articles a month, pooled across websites on the account. Include that cost in the appropriate program allocation alongside review and distribution work; it isn't a promise of a particular financial return.
Content marketing ROI FAQs
What is a good content marketing ROI?
Judge it against your own margin definition, full costs, attribution rule, time window, and alternative use of resources. A percentage from another business is not a reliable target when those inputs differ.
Can we calculate ROI from traffic alone?
Traffic can show discovery, but it doesn't establish a financial return. Connect the relevant customer actions to supported revenue and costs. If that route is unavailable, report traffic and other progress measures with their limitations.
Should every article have its own ROI?
Only when the evidence supports that level of analysis. A connected program can be a more defensible unit when several assets contribute to the same journey. Keep article-level evidence useful for diagnosis without forcing an unsupported financial allocation.