AI A/B Testing: A 12-Step Experiment Workflow
Plan AI A/B testing in twelve steps with Optimizely and Statsig examples, an experiment template, checked arithmetic, and result interpretation checks.

AI A/B testing uses AI to assist with experiment ideas, copy variations, implementation review, or analysis. The experiment still depends on a fair comparison: defined groups, consistent assignment, trustworthy events, and an analysis method chosen before interpreting the outcome.
An assistant can suggest a clearer CTA. It cannot establish that the CTA improves conversion by reading the page or predicting a winner. That conclusion requires an appropriately designed and analyzed experiment.
This guide uses current Optimizely and Statsig documentation. The specification and arithmetic exercise are teaching examples, not results from an experiment on those companies’ websites. Rankauto publishes this guide and supports blog production.
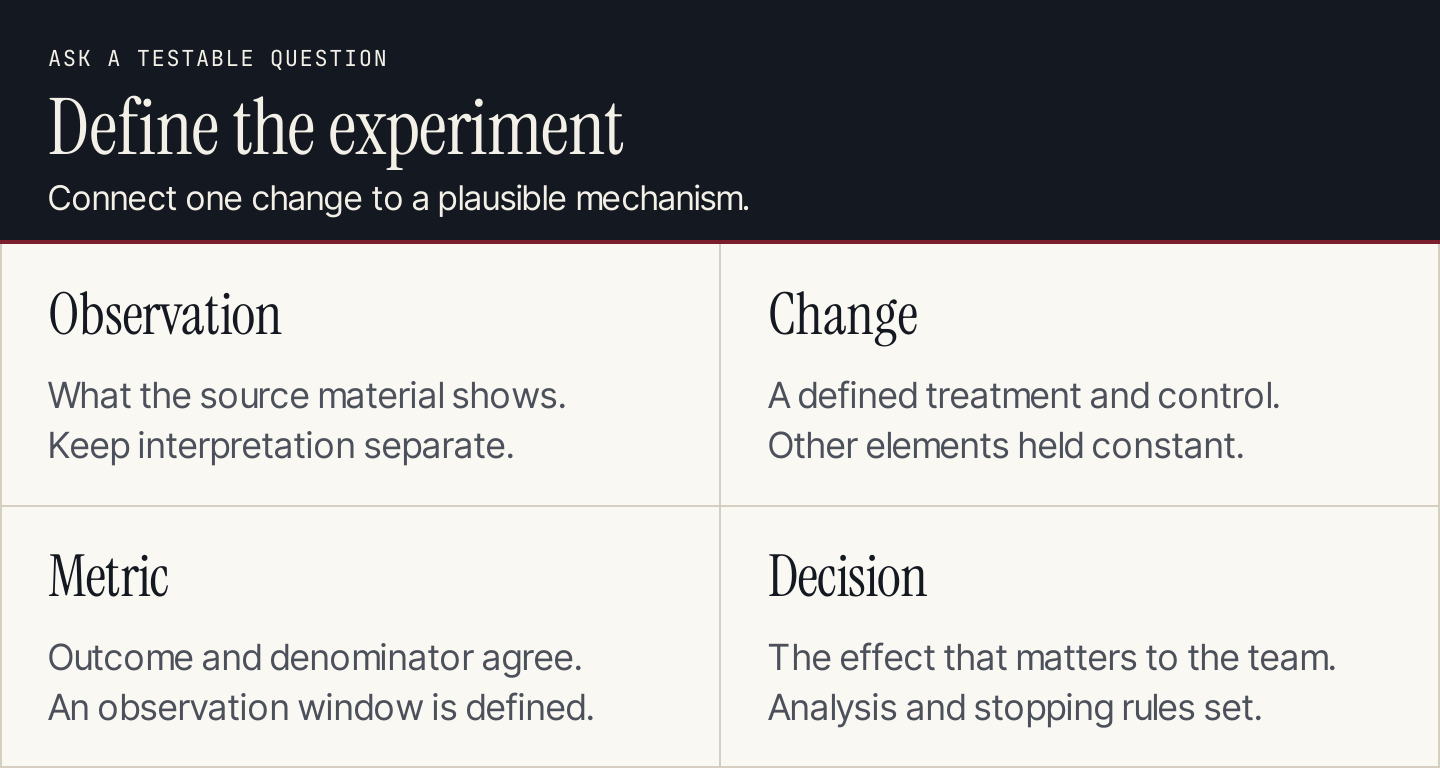
Write the question and decision before generating variations.
AI assistance and traffic allocation are different jobs
An AI copy assistant generates candidates. An experimentation system assigns eligible units, records exposure, and compares outcomes. An adaptive allocation system may change traffic shares as it learns. Those are different mechanisms and require different analysis assumptions.
| Job | Appropriate AI contribution | Required verification |
|---|---|---|
| Hypothesis | Summarize observations and propose explanations | Original observation and competing explanations |
| Variation | Draft copy within accepted claims | Meaning, layout, and destination |
| Setup review | Inspect the written specification for omissions | Implemented assignment and event behavior |
| Readout | Explain checked platform output | Method, diagnostics, uncertainty, and decision rule |
The twelve stages below describe an experiment lifecycle. They are not a list of twelve products or a claim that more variations produce stronger results.
1. Begin with an observation
Write what you saw before explaining why it happened. For a resource page, the observation might be that readers reach the CTA but interviews suggest they misunderstand what opens next.
Separate the source of that observation from the proposed test. A session recording may suggest confusion; it does not prove that changing the button will resolve it.
Use our landing page guide to inspect the experience before commissioning variants. A broken link or unusable form should be repaired directly, rather than tested against a working version as a marketing idea.
2. Write a hypothesis with a mechanism
Use a simple structure: for this audience, changing this element may affect this behavior because of this observed problem.
For the proposed resource-page test: “A CTA naming the next destination may improve outbound resource clicks because readers can understand what opens before clicking.” The mechanism is clearer expectation, not a claim that one phrase is universally persuasive.
Keep competing explanations in view. Placement, relevance, page speed, and the offer itself can also affect whether people continue.
3. Define eligibility and the assignment unit
Decide who can enter the experiment and what entity stays in a group: a signed-in user, a device identifier, a session, or another appropriate unit.
Statsig’s experiment overview explains consistent assignment by randomization unit and the trade-offs among user, device, and session identifiers. A device can represent more than one person, while one person can use multiple devices.
Record exclusions, including internal testing traffic. Check how returning visitors and cross-device visits behave. Do not casually call device counts “unique customers.”
4. Define the metric and its denominator
For a CTA test, “clicks” needs a definition. Are you counting every click event, units with at least one click, or sessions containing a click?
Our proposed primary metric is the proportion of exposed eligible device IDs with at least one outbound resource click during a defined observation window. The numerator and denominator use the same unit. Repeated clicks by one device do not become additional converting devices.
Choose relevant guardrails too, such as page errors or another important action displaced by the change. Define how long outcomes can accrue after exposure, so early entrants do not receive a longer measurement window than later ones without that being accounted for.
5. Check whether the experiment is feasible
Before launch, use eligible traffic and a defensible baseline to plan sample size or duration for the effect you need to detect. A smaller detectable effect usually requires more information than a large one.
Statsig’s power-analysis documentation describes the relationship among effect size, duration or exposures, and allocation. It also warns that a population unlike the intended audience can produce misleading estimates.
Include the number of groups, significance level, desired power, and handling of multiple comparisons in the plan. Let the chosen statistical system handle the calculation and have someone competent review the assumptions. A general-purpose assistant’s confident duration estimate is not a sample-size plan.
If eligible traffic is too low, simplify the comparison, extend a suitable observation period, or use qualitative research to improve the next hypothesis. Avoid promising that a seven-day run will be conclusive.
6. Produce controlled variations
Optimizely documents AI-generated copy suggestions for selected text elements in its Visual Editor. You can preview suggestions and use one in a current or new variation. Generated text still needs review for accuracy.

Optimizely’s documentation shows copy generation attached to a selected page element. Source: Optimizely.
For our proposed test, keep the resource, layout, CTA position, and destination constant. Compare “Explore resources” with “View the training resources.” Both must truthfully describe the destination. If you change the headline, image, and button together, the experiment evaluates that combined package rather than the isolated CTA wording.
Keep the candidate list small. More generated options increase review work and may increase the traffic and statistical adjustments needed for a comparison.
7. Freeze a written experiment specification
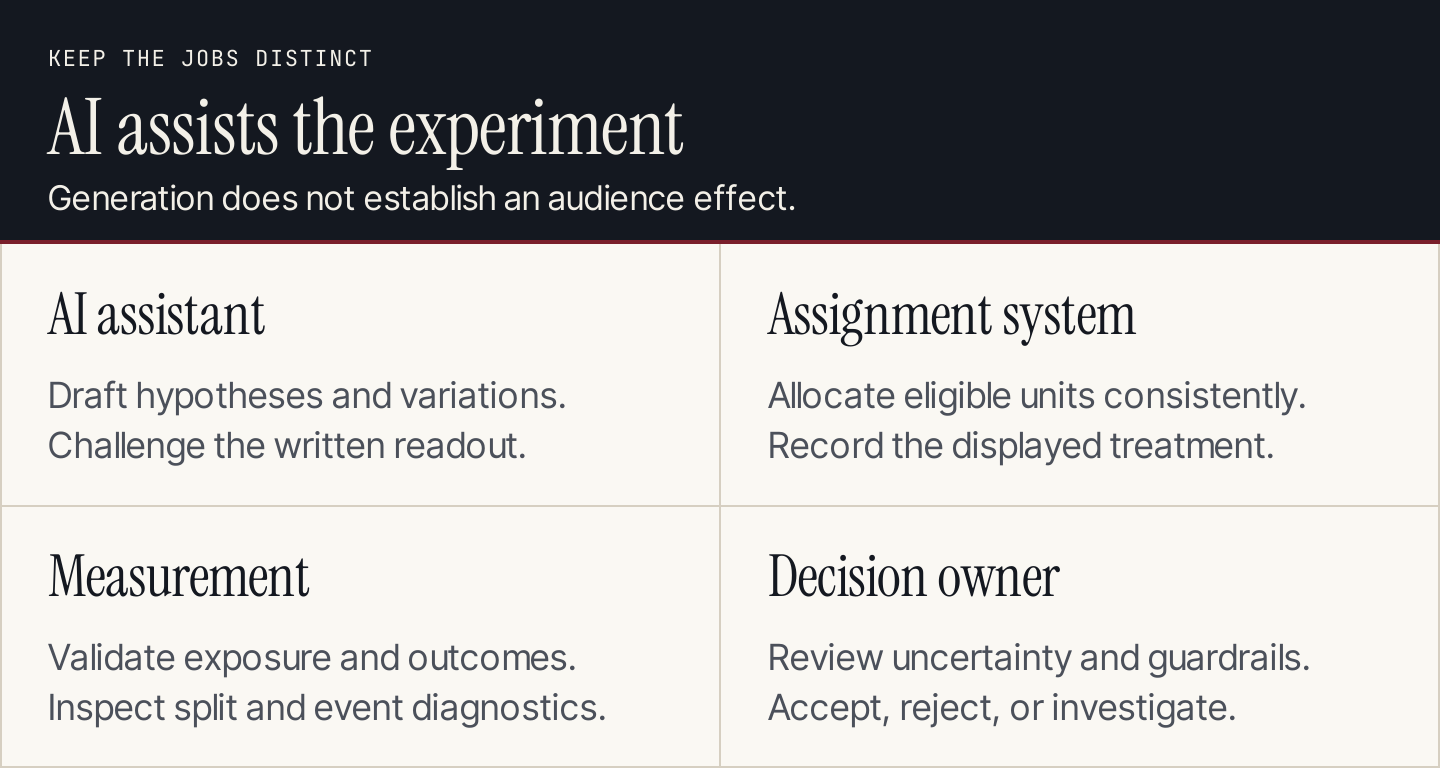
Keep drafting, assignment, measurement, and the final decision distinct.
Use this specification as a starting point:
| Field | Proposed specification |
|---|---|
| Question | Does naming the destination affect outbound resource clicking? |
| Control | Explore resources |
| Treatment | View the training resources |
| Constant elements | Resource page, destination, layout, CTA location |
| Eligibility | Defined resource-page visitors; internal traffic excluded |
| Assignment | Persistent device ID; planned equal split |
| Primary metric | Exposed device IDs with a resource click / exposed device IDs |
| Guardrails | Page errors and other agreed task outcomes |
| Analysis | Chosen platform method, planned effect and sample requirements |
| Stop conditions | Predefined completion and technical failure rules |
| Ownership | Campaign owner, implementation owner, analysis reviewer |
The fields above describe a proposal. Fill in the observation window, sample plan, and diagnostic rules before launch. Save the accepted version so later edits cannot silently change the question.
8. Test assignment and events before launch
Inspect both variants on desktop and a phone. Verify that the intended text appears, the link works, the page remains accessible, and the change does not create flicker or layout problems.
Check that exposure records correspond to the intended eligibility and displayed variation. Confirm the outcome event fires as defined, is linked to the assigned unit, and handles repeated clicks correctly.
Test returning visits, missing identifiers, consent-dependent measurement, and important browser or device differences. Use the platform’s supported preview or override workflow for these checks. Keep preview traffic out of the production comparison.
9. Monitor experiment health
A planned equal split will rarely produce perfectly identical counts. A sample ratio mismatch, or SRM, is an imbalance beyond what the diagnostic expects from random variation.
Statsig’s SRM guide explains why biased exposure logging or assignment problems can invalidate a readout. A small-looking percentage difference can matter at large volume.
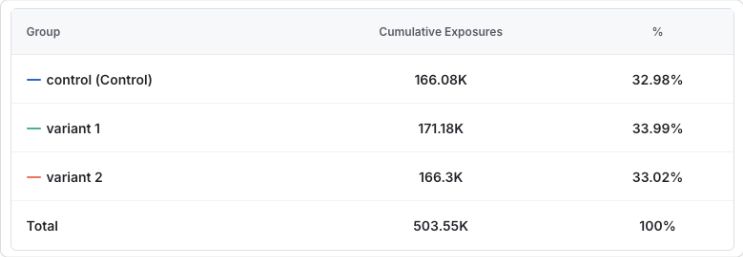
Statsig’s documented example shows why exposure shares need a diagnostic, not a visual guess. Source: Statsig.
Investigate persistent warnings before trusting the reported lift. Do not repair a biased comparison by casually removing inconvenient segments or restarting repeatedly until the result looks favorable.
10. Follow the planned stopping method
Monitoring errors and guardrails is necessary. Declaring a winner whenever a favorable result appears is a different action.
Use the stopping and analysis rules supported by the chosen method. Fixed-horizon, sequential, and adaptive approaches have different requirements. Record changes to allocation, targeting, copy, and event definitions; material changes may require a new experiment rather than a continuation of the original one.
An urgent technical problem can justify stopping delivery. Document that reason instead of presenting the interrupted run as a completed test.
11. Check the arithmetic and the uncertainty
The following numbers are an invented arithmetic exercise, not campaign observations or a sufficient statistical readout:
| Group | Exposed devices | Devices with a click | Observed rate |
|---|---|---|---|
| Control | 2,000 | 100 | 5% |
| Treatment | 2,000 | 120 | 6% |
The observed difference is 1 percentage point. Relative to the 5% control rate, the observed increase is 20%: (6% - 5%) / 5%.
Those calculations do not establish statistical significance, a durable effect, or a business win. A decision also needs the experiment’s validated method, uncertainty interval, diagnostic status, observation window, and guardrails. Do not describe a 20% relative increase as a 20-percentage-point increase.
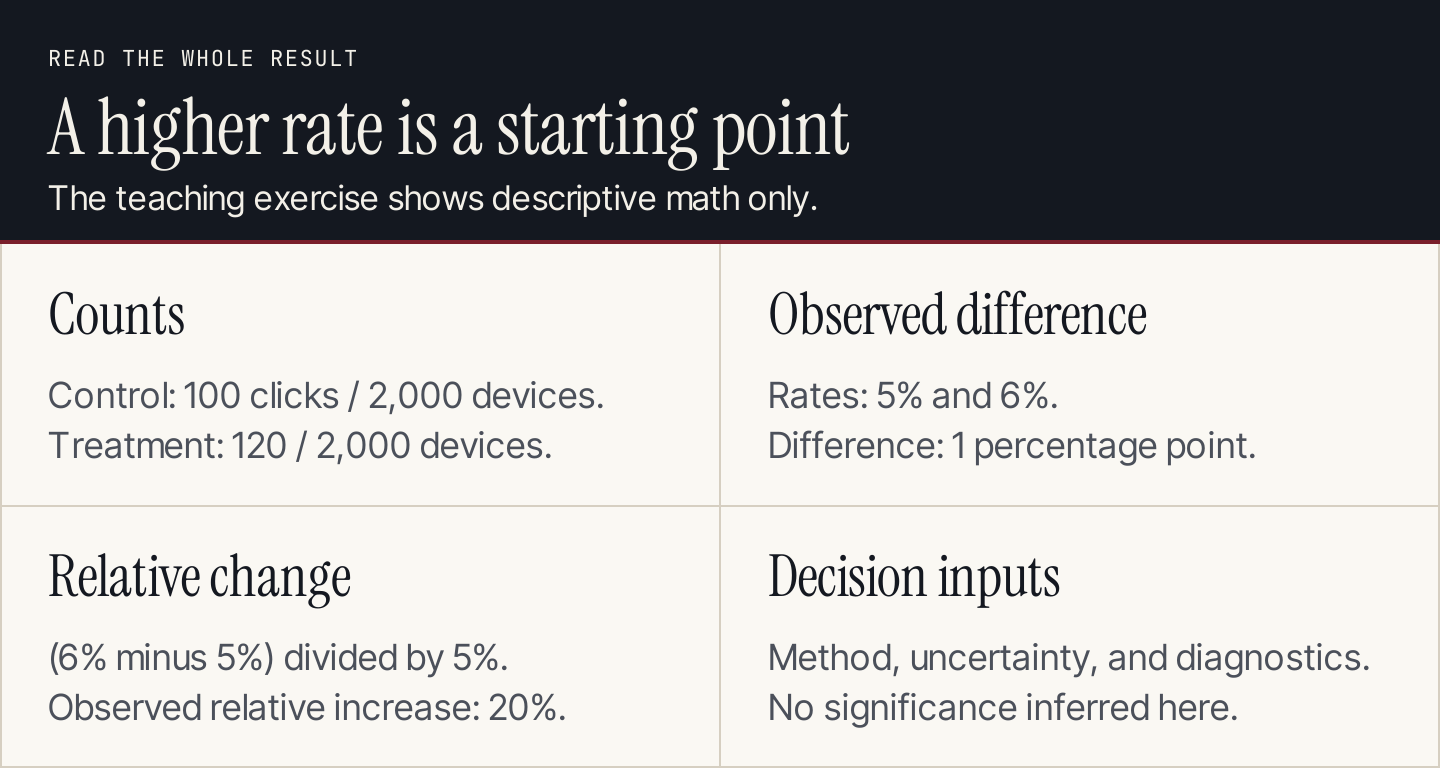
A higher observed rate starts the readout. It does not complete the decision.
Ask AI to challenge the report after the platform output has been checked:
Review this experiment specification and validated readout.
Check metric units, denominators, observation windows,
assignment diagnostics, stopping rules, and guardrails.
Recalculate the descriptive rates and absolute/relative changes.
Separate observation, statistical conclusion, and recommendation.
Use only the supplied method output for uncertainty.
List missing information; do not invent significance or causes.
12. Record a decision, including inconclusive results
Save the specification, accepted variants, dates, diagnostics, method output, outcome, and decision owner together. State whether to adopt, reject, investigate, or continue under the original plan.
An inconclusive result does not prove the variants are equivalent. It may mean the data cannot distinguish effects of the size the team cares about. Use that limitation when choosing the next experiment.
Our AI marketing analytics guide covers report verification more broadly. The AI ad creative guide connects the specification to the production of controlled creative variations.
Questions about AI A/B testing
Can AI run the whole experiment?
Some products connect generation, setup, and analysis. Confirm what your chosen system implements and what it leaves to your team. A fluent summary does not replace assignment, event validation, or an accepted statistical method.
What should a small team test first?
Choose a consequential question with a plausible mechanism, working measurement, and enough eligible traffic. Fix obvious defects first. Use our meta title generator to explore supporting article titles, but treat those outputs as candidates rather than predicted winners.
Where does Rankauto fit?
Rankauto helps produce the supporting blog articles and prepare them for supported publishing destinations, with drafts by default. Use an experimentation platform for visitor assignment and statistical analysis.