AI Marketing Analytics: From Data to Decisions
Apply seven AI marketing analytics jobs with documented reporting examples, a checked numerical exercise, prompts, and a decision memo teams can review.

AI marketing analytics uses AI to help people question, interpret, and explain marketing data. Depending on the system, that can mean asking a report a question, reviewing a dataset, proposing a query, or drafting a decision brief.
The advantage is easier access to analysis. The difficult part remains deciding what the numbers represent. A polished explanation can still compare different date ranges, confuse leads with customers, or describe a correlation as the reason something happened.
Start with one decision and one trusted dataset. This guide covers seven analysis jobs, documented reporting interfaces, and a numerical exercise you can check without accepting an AI answer on faith. Product references were reviewed in October 2026.
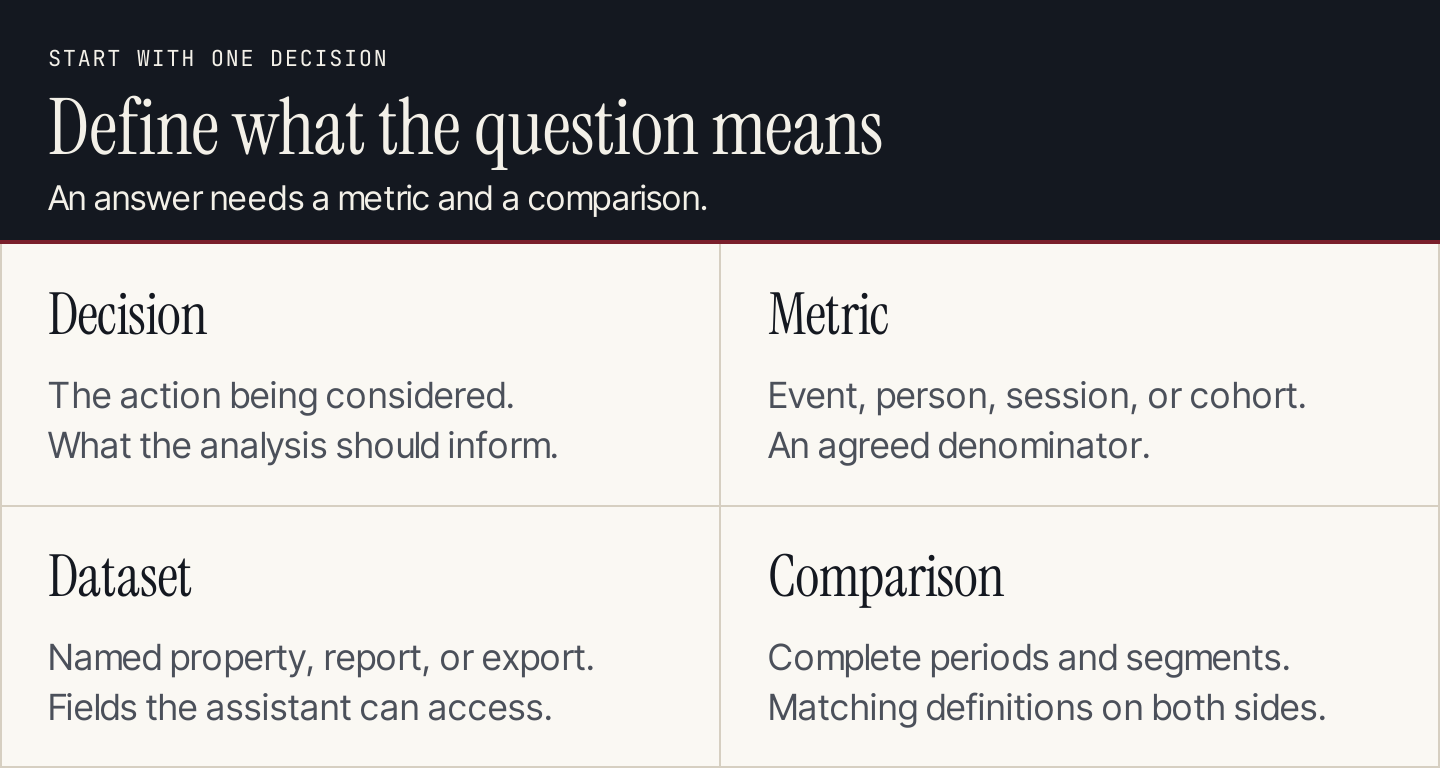
Define the comparison before asking the assistant to explain the result.
What AI marketing analytics can do
An assistant inside an analytics platform can work with the information and permissions available there. A general chat model needs the data, a connection, or an approved export. It cannot infer your current campaign results from a dashboard name.
There are also different levels of analysis. Describing a change is easier to support than explaining its cause. Predicting an outcome requires a method and enough relevant history. Recommending a budget change requires understanding costs, constraints, and uncertainty beyond a single chart.
Use our content performance guide to choose the metrics first. AI can then help investigate a defined question, rather than producing an attractive summary of whatever fields happen to be available.
7 analysis jobs, with a check for each
1. Translate a business question into report fields
Ask the assistant to identify the metric, dimension, filters, period, and comparison needed. “Which content is working?” should become a narrower question, such as which landing pages contributed to completed inquiry events during the same complete reporting period.
Check the event definition and whether the report counts events, sessions, or people. A person who submits twice can create two events without becoming two new prospects.
2. Find the right report
An assistant can help navigate an unfamiliar interface or identify the report likely to answer a question. This is valuable even when no advanced modeling occurs.
Open the destination report and inspect its scope. An answer based on website sessions does not establish the number of opportunities accepted by sales unless those records have been connected and defined.
3. Compare periods and segments
AI can propose breakdowns by channel, device, landing page, or campaign. Use the same metric definition and complete periods on both sides of the comparison.
Check absolute counts alongside percentages. A large percentage change from a tiny base may deserve investigation, but it does not automatically deserve the largest share of attention.
4. Identify changes worth investigating
Ask for unusually large movements, missing values, or changes concentrated in one segment. Treat the result as a shortlist of questions.
Inspect collection changes and operational context before accepting an explanation. A changed form, tracking event, campaign label, or qualification rule can change a report even when customer behavior has not changed in the same way.
5. Draft a query or calculation
With the right tool, AI can propose a query or calculate rates from a supplied table. Request the fields, filters, aggregation, and formula along with the answer.
Check the calculation in the reporting system or a spreadsheet. Do not ask the model to silently estimate missing costs or turn an unavailable revenue field into an ROI result.
6. Generate competing explanations
Give the assistant the checked observations and ask for several possible explanations, plus the information that would distinguish them. This is a strong use of AI because it broadens the investigation without requiring a premature conclusion.
For a conversion-rate decline, alternatives might include a changed traffic mix, a form problem, or slower follow-up. Each requires a different check. The report alone may not establish which explanation is correct.
7. Draft the decision memo
After checking the analysis, ask for an observation, its limitation, a proposed action, and a review date. Name the owner and the outcome being assessed.
Keep the action proportional to what is known. A small diagnostic test may be justified before reallocating a large campaign budget. The memo should make that reasoning visible.
Three reporting examples and their roles
Google Analytics Advisor: questions inside the property
Google's Analytics Advisor help describes a conversational assistant for questions about Analytics data and the product itself. The feature is in beta and subject to the eligibility and language conditions in the documentation.
Its scope matters: an answer about data in an Analytics property is not automatically a joined view of your CRM, accounting system, and advertising costs. Use questions the connected property can answer, then open the relevant report or visualization to inspect the result.
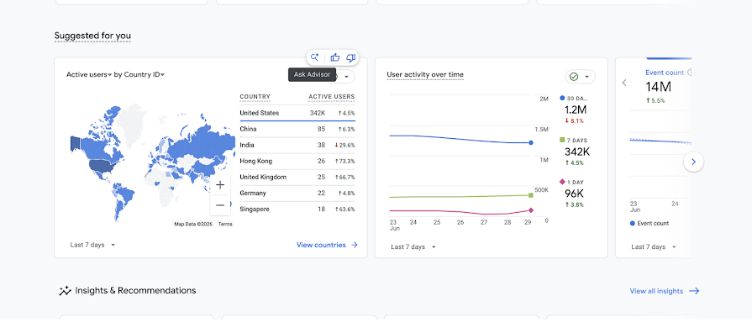
Google's documentation illustrates the Ask Advisor entry point beside Analytics report cards. The displayed values are Google's example, not this article's dataset. Source: Analytics Advisor.
Try a bounded question: “Compare completed inquiry events by session source for the last two complete calendar months.” Then inspect the property, event name, date boundaries, and source dimension selected. If the answer uses a different definition, correct the question before drawing a conclusion.
Looker: conversational analysis needs governed definitions
Looker's conversational analytics overview explains how the system uses the LookML model, including defined metrics, relationships, and permissions. Those definitions help determine what the question means in that environment.
The Looker data-query guide describes opening a result in Explore and inspecting how it was calculated. Use that route to review the selected fields, filters, and aggregation.
This is a different setup from uploading a loosely labeled spreadsheet. If your business has not defined “qualified lead” consistently, conversational access will not settle the definition for you. Agree on it first, then make sure the model and report use it.
HubSpot: use the report as a checking surface
HubSpot's marketing analytics suite documentation organizes reports around marketing questions. Its report information explains properties and filters; some attribution and journey capabilities require higher subscriptions.
This example shows standard reporting, rather than establishing that every report is an AI feature. A clear report is still an important checking surface for an AI-generated explanation.
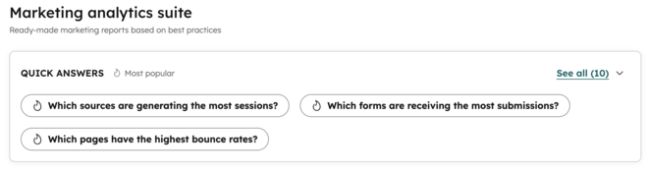
These report questions help define what should be measured before asking AI for an explanation. Source: HubSpot marketing analytics suite.
Choose a tool by its access to the required data, clarity of metric definitions, ability to inspect the calculation, and fit with the team's review process. A tool list is less helpful than answering those four questions for your own reporting environment.
A worked example: more leads, weaker qualification
The numbers below are an original teaching dataset. They do not describe a company, a campaign test, or a vendor's results. Assume both periods are complete and use the same session, inquiry, and qualification definitions. Qualified inquiries belong to the inquiry cohort in the same row and have had the same follow-up window.
| Channel and period | Sessions | Inquiries | Qualified inquiries |
|---|---|---|---|
| Organic, period A | 2,000 | 100 | 40 |
| Paid, period A | 1,000 | 80 | 16 |
| Organic, period B | 2,500 | 125 | 50 |
| Paid, period B | 2,000 | 120 | 18 |
| Total, period A | 3,000 | 180 | 56 |
| Total, period B | 4,500 | 245 | 68 |
Inquiries rose from 180 to 245, an increase of 36.1%. Qualified inquiries rose from 56 to 68, or 21.4%. Those statements can both be true while the share of inquiries that qualify falls.
Use three calculations:
Inquiry rate = inquiries / sessions
Qualification share = qualified inquiries / inquiries
Qualified-inquiry rate = qualified inquiries / sessions

Period A inquiry rate: 180 / 3,000 = 6.00%
Period B inquiry rate: 245 / 4,500 = 5.44%

Period A qualification share: 56 / 180 = 31.11%
Period B qualification share: 68 / 245 = 27.76%

Period A qualified-inquiry rate: 56 / 3,000 = 1.87%
Period B qualified-inquiry rate: 68 / 4,500 = 1.51%
The qualified-inquiry rate fell by about 0.36 percentage points. That is approximately a 19.0% relative decline. Percentage points and relative percentages describe different comparisons; label them clearly.
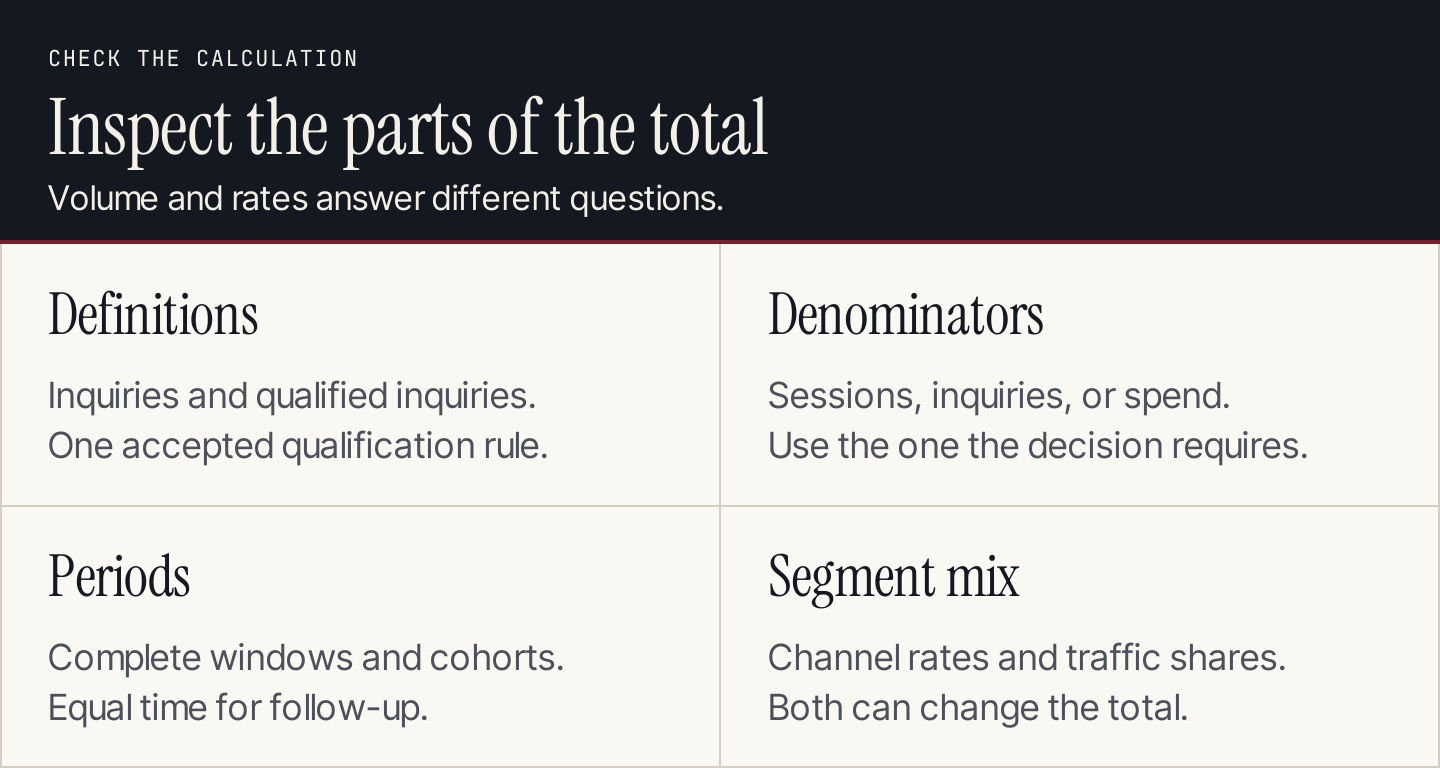
A total can hide a different pattern inside each channel. Check the parts before explaining the whole.
Organic's qualified-inquiry rate stayed at 2% in both periods. Paid's rate fell from 1.6% to 0.9%. Paid also grew from one-third of sessions to about 44.4%. Both the weaker paid rate and the larger paid share affect the combined result.
The table does not establish why paid qualification weakened. It contains no spend, targeting changes, form diagnostics, or sales notes. It also cannot establish profitability. Use our content ROI guide when the decision requires costs and attributed returns.
Ask AI to analyze, then challenge the answer
Paste the table and definitions into an approved analysis tool with this prompt:
Analyze the supplied teaching dataset. Use its definitions unchanged.

Show totals and formulas for inquiry rate, qualification share,
and qualified-inquiry rate. Compare periods by channel and overall.
Distinguish percentage-point changes from relative changes.

Separate:
- observations supported by the rows;
- possible explanations that need more information;
- missing fields needed for a budget decision.

Do not infer spend, profit, causality, or customer revenue.
Return a short memo and an audit table of calculations.
Challenge the response with three questions: Did it compare matched cohorts? Did it confuse inquiry growth with improved qualification? Did it recommend a budget change without costs? Recalculate the headline numbers before forwarding the memo.
Turn the result into a decision
A defensible memo for the teaching dataset would read:
Qualified inquiry volume increased, while qualified inquiries per session declined. Organic's rate was stable; paid's rate weakened as paid became a larger share of traffic. Review paid-campaign changes and qualification reasons before expanding that spend. The dataset does not establish cause or profitability.
Assign one person to compare paid campaign labels, landing pages, form completion, and sales rejection reasons across the periods. Select the next test after that investigation. Keep unrelated variables steady where possible and agree on the follow-up window before evaluating its outcome.
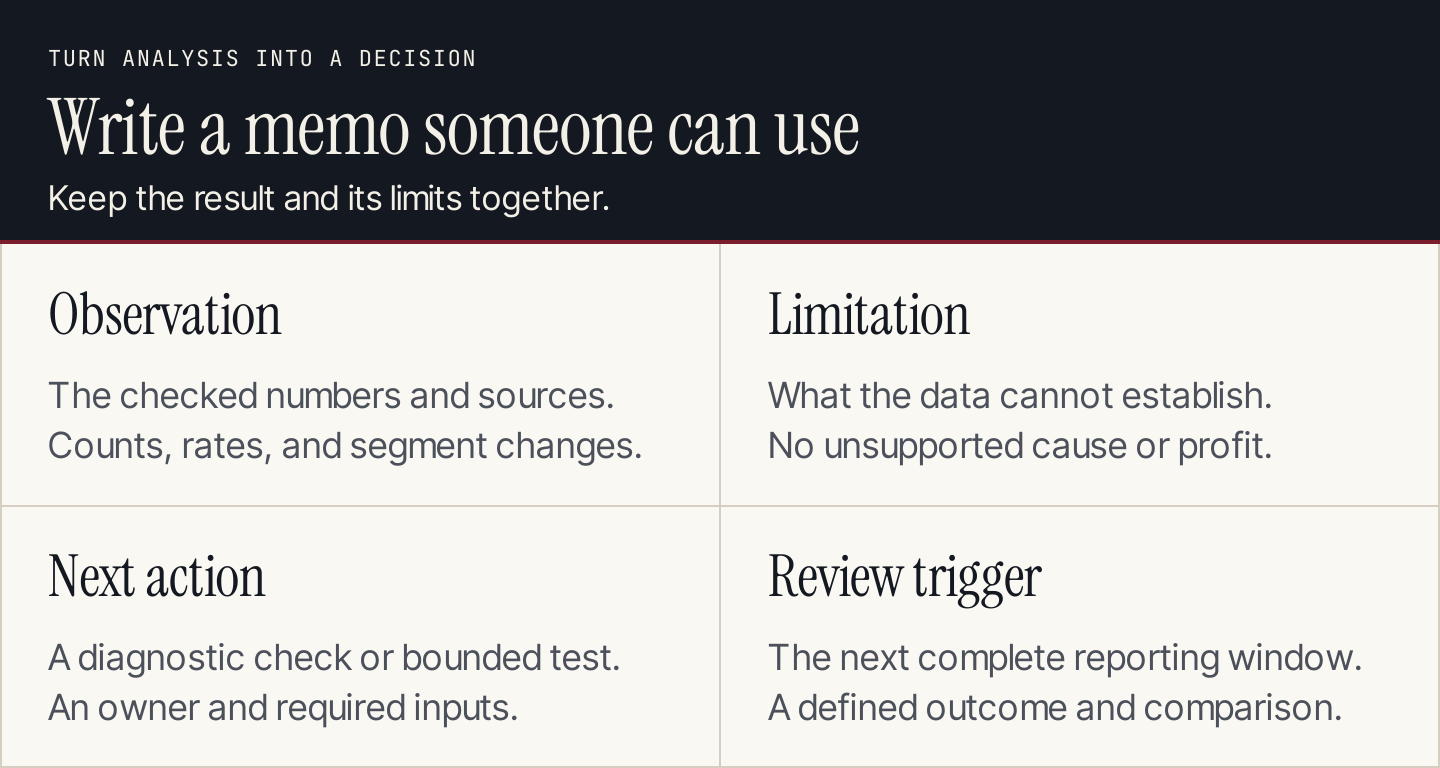
The finished output is a decision someone can inspect and own, with a reason to revisit it.
Use our UTM builder to keep campaign labels consistent. AI cannot reliably repair ambiguous naming after several teams have used the same label for different campaigns.
Make the reporting workflow repeatable
Save the accepted question, metric definitions, source report, export time, calculation, and memo together. Record any changes to tracking or qualification rules. On the next run, compare the setup before comparing performance.
If an assistant cannot retrieve the data, mark the report incomplete. Do not let last month's values appear under a new date. If a field disappears, fix the source mapping before generating another confident summary. Our AI marketing automation guide covers how to connect recurring work with review and exception handling.
For a small team, one trusted report and a short reviewed memo are enough to begin. Add more connected sources when the decision requires them, with definitions that explain how records are matched.
Where Rankauto fits
Rankauto creates researched blog articles and supports publishing to your connected destination, with drafts by default. It is not a business-intelligence platform or a replacement for campaign analytics. Use your analytics workflow to identify the questions readers need answered, then turn those decisions into a clearer content plan.
Questions about AI marketing analytics
Can AI explain why a campaign changed?
It can suggest explanations and identify patterns in the available data. Establishing a cause usually requires additional information or an appropriate experiment. Ask what would distinguish the competing explanations.
Can I use a general chat tool with a spreadsheet?
Yes, if the tool supports the file and your organization permits that use of the data. Supply field definitions, dates, and the decision being considered. Check the calculations and avoid including information the task does not require.
Should every marketing report include a forecast?
No. A forecast needs a suitable method, history, and stated assumptions. For many weekly reviews, a checked comparison and a clear next question are more valuable than an unsupported prediction.