Content Performance: 18 Metrics and a Reporting Template
Measure content performance with 18 metrics, clear definitions, an illustrative calculation, and practical measurement and reporting templates.

Content performance measures how well an article, video, email, or resource serves its intended role. That role might be reaching the right audience, helping someone complete a task, generating useful inquiries, or keeping customer guidance accurate.
A report full of counts can still miss the decision. Start with the content's job, select a few measures that reflect it, and define exactly what each number includes.
This guide covers 18 measures, a worked example, and a reporting template. You don't need all 18 for every asset. Choose the ones that answer a real question and that your team can collect reliably.
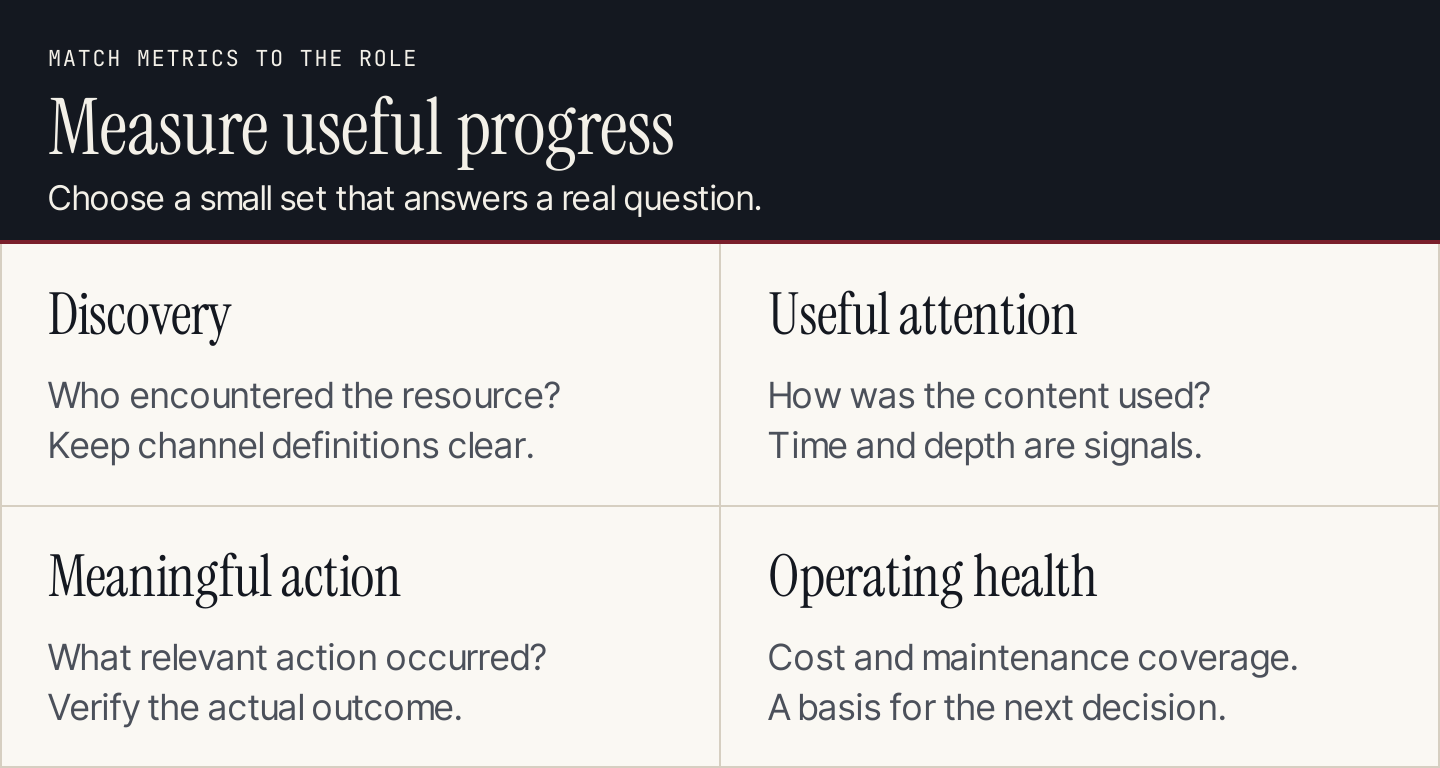
Measure the intended role, from discovery through useful action and maintenance.
Set the measurement scope first
Write down the asset or content group, period, audience, channels, and exclusions. A homepage visit, an article landing session, and an email recipient are different units. Combining them without explanation produces rates nobody can interpret.
For website content, distinguish all page use from entry-page use. The GA4 Pages and screens report covers pages visited throughout sessions; a landing-page analysis focuses on where sessions begin. Choose the view that fits your question.
Keep the URL list or content grouping rules with the report. Record changes in measurement, campaign distribution, or consent coverage that could affect comparisons. If a number isn't available, mark it unavailable instead of treating it as zero.
Eighteen metrics to choose from
Discovery and repeat use
1. Reach or impressions
Use the platform's stated definition. Reach typically concerns people or accounts reached; impressions concern displays and can include repeated exposure. Different platforms don't necessarily count them the same way.
Ask whether distribution reached the intended audience. Don't add reach across channels and call it unique people unless you have a reliable deduplication method. An impression also isn't evidence that someone read the content.
2. Pageviews
Pageviews show use of a page, including repeat views. They help identify which resources people visit and where more detailed investigation may be worthwhile.
GA4's Pages and screens documentation defines views and related page-level metrics. Use the count for exposure to the page, not as a count of distinct readers. An increase may reflect distribution, repeat use, or a measurement change, so inspect context before declaring success.
3. Active users
Active users help describe the distinct audience recorded by your analytics system. In GA4, this is a defined active-user measure rather than a synonym for every person who could have encountered the article.
Compare it with views to understand repeat page use, while preserving the reporting period and filters. Identity, device changes, and consent coverage limit what a web report can establish about distinct people.
4. Returning-reader share
For a reference resource, repeat use can be valuable. Define returning readers using the reporting system and a stated lookback window, then calculate the share within the relevant audience.
Avoid interpreting every return as satisfaction. Someone may return because the task is useful, unfinished, or difficult. Pair the measure with a task outcome or feedback. If identity coverage is weak, describe the recorded behavior rather than claiming a complete view of customer loyalty.
Attention and task use
5. Average engagement time
Use time as an attention signal, with its collection rule attached. GA4 user engagement records engagement while a website is in focus or an app is in the foreground. This isn't the same as wall-clock reading time.
State the exact metric and denominator from the report you use. Longer time can reflect interest or difficulty. A reference page that quickly supplies the answer may need less time than a tutorial.
6. Engaged-session rate
In GA4's engagement definitions, an engaged session lasts more than 10 seconds, includes a key event, or has at least two page or screen views. The rate is engaged sessions divided by sessions; bounce rate is its inverse.
This is a collection definition, not a judgment that the article was persuasive. Use it to investigate behavior, then check a measure closer to the content's actual purpose.
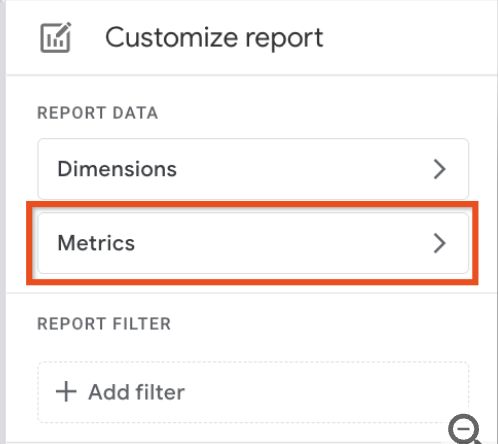
GA4 shows how report metrics can be selected during customization. Source: Google Analytics.
7. Scroll-threshold reach rate
Define the threshold and count eligible sessions that reach it. GA4 enhanced measurement sends its default scroll event the first time 90% vertical depth becomes visible on each page.
That event doesn't prove comprehension or task completion. If you're reporting a rate, deduplicate the relevant sessions and state the denominator. A page's length and layout affect what reaching the threshold means.

The default scroll event measures a visibility threshold. Source: Google Analytics.
8. Video-completion rate
Choose a defined completion event and divide qualifying completions by the eligible starts or viewers you specify. Keep that unit consistent.
Player coverage matters. GA4's enhanced video measurement applies to qualifying YouTube embeds with the required API support; it doesn't automatically cover every video player. Completion is useful for investigating pacing or relevance, but it doesn't show that the viewer can perform the demonstrated task.
9. Internal CTA click rate
Measure clicks on the article's intended next action. Use a named custom measurement when needed and divide sessions with that click by eligible article sessions.
The default outbound-click event shouldn't be assumed to cover an internal button. Verify the actual collection setup. Label the CTA and destination so you can distinguish “download the worksheet” from “contact us.” A click is an intermediate action, not a completed inquiry.
10. Resource or task completion
For a worksheet, calculator, or tutorial, identify the completion state that matters. This may require a custom event, an application record, or feedback collected after use.
A file download doesn't prove someone filled in the worksheet. A button press doesn't prove a tool produced a usable result. Define the observable state you can establish, and name the limitation when the actual use happens outside your measurement system.
11. Newsletter click rate
Choose a documented email-platform definition. A useful reporting version is unique recipients who click the intended content link divided by delivered messages, with automated-click filtering where available.
Keep the delivery unit separate from website sessions. One recipient can click more than once, and some clicks may be automated. Compare the same campaign scope and collection method. The email report describes a distribution step; the destination's task outcome tells you more about content usefulness.
12. Shares and substantive discussion
Record the platform's share count separately from a qualitative review of discussion. Look for questions, corrections, or explanations that reveal how the audience understood the piece.
Don't merge every reaction into a single “meaningful engagement” total. A useful customer question can suggest a missing section even when the post has few reactions. Keep a small feedback log with the comment's context and the editorial action it suggests.
Business outcomes and operating health
13. Accepted inquiries
Count inquiries actually accepted by your form or business system, using an agreed deduplication rule. A form attempt, validation error, or repeated submission shouldn't automatically count as another lead.
Google's recommended events distinguish lead-generation and lead-qualification events. They need appropriate implementation and business context. Agree with the team handling inquiries on what acceptance means, then verify that the reported event matches that state.
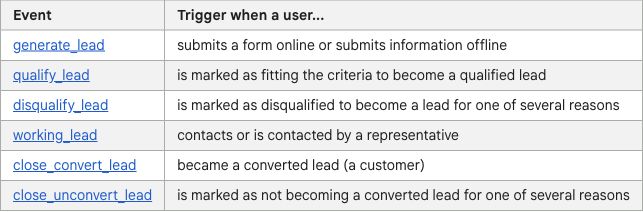
Google separates stages of the lead lifecycle. Source: Google Analytics.
14. Qualified-lead share
Divide leads meeting the agreed qualification rule by accepted inquiries in the relevant cohort. Record the rule, owner, and allowance for qualification delay.
This measure can show whether a content topic attracts suitable inquiries. It can also reveal that the CTA or description attracts the wrong expectations. Don't change the qualification rule silently between reports or compare a fully assessed older cohort with a newer one still awaiting review.
15. Session key-event rate
For a session-based rate, count eligible sessions with at least one relevant key event and divide by eligible sessions. Repeated event occurrences within one session shouldn't inflate that numerator.
State which event matters and why it represents progress. Marking a low-value action as a key event can raise a rate without improving the business outcome. Keep article landing sessions separate from sessions that encountered the article somewhere later in the journey.
16. Content-attributed or content-influenced opportunities
Use CRM records and an explicit credit rule. “Attributed” may assign credit under a model; “influenced” may mean the opportunity had a recorded content interaction. These are different claims.
Keep the opportunity stage, period, and eligible interaction visible. Don't credit all revenue to the most recent article a buyer visited. Long buying cycles and incomplete tracking make a transparent, limited interpretation more useful than a precise-looking total with no method.
17. Content cost
Include the costs relevant to the decision: research, writing, review, design, distribution, tools, and maintenance. State whether staff time is included and how shared costs are allocated.
Cost per accepted inquiry or qualified lead can support an operational comparison when the cohort is consistent. It isn't automatically return on investment. For the separate financial question, use our content marketing ROI guide.
18. Freshness coverage
Define the owned asset set and the review criteria. Divide assets meeting those criteria by the assets in scope. A current review should check substantive accuracy, working instructions, and relevant destinations, rather than merely changing the date.
This is a content-operations measure, not an analytics-platform default. It helps teams see whether a growing library remains maintainable. Keep critical outdated assets visible instead of allowing a high overall percentage to hide them.
A worked example with consistent denominators
The following figures are illustrative, not Rankauto results or an industry benchmark. Assume one reporting period with 500 eligible article-landing sessions under the same filters:
- 300 sessions meet the engaged-session definition.
- 200 distinct sessions reach the chosen scroll threshold.
- 50 distinct sessions click the intended CTA.
- 20 sessions produce 20 deduplicated accepted inquiries.
- Eight of those inquiries meet the agreed qualification rule after review.
- Allocated production and distribution cost is $600.
| Measure | Calculation | Result | What it can establish |
|---|---|---|---|
| Engaged-session rate | 300 / 500 | 60% | Sessions meeting the collection definition |
| Scroll-threshold rate | 200 / 500 | 40% | Sessions reaching the chosen depth |
| CTA click rate | 50 / 500 | 10% | Sessions taking the intended intermediate action |
| Inquiry session rate | 20 / 500 | 4% | Sessions with an accepted inquiry |
| Qualified-lead share | 8 / 20 | 40% | Accepted inquiries meeting the business rule |
| Cost per accepted inquiry | $600 / 20 | $30 | Allocated cost per inquiry in this cohort |
| Cost per qualified lead | $600 / 8 | $75 | Allocated cost per qualified lead in this cohort |
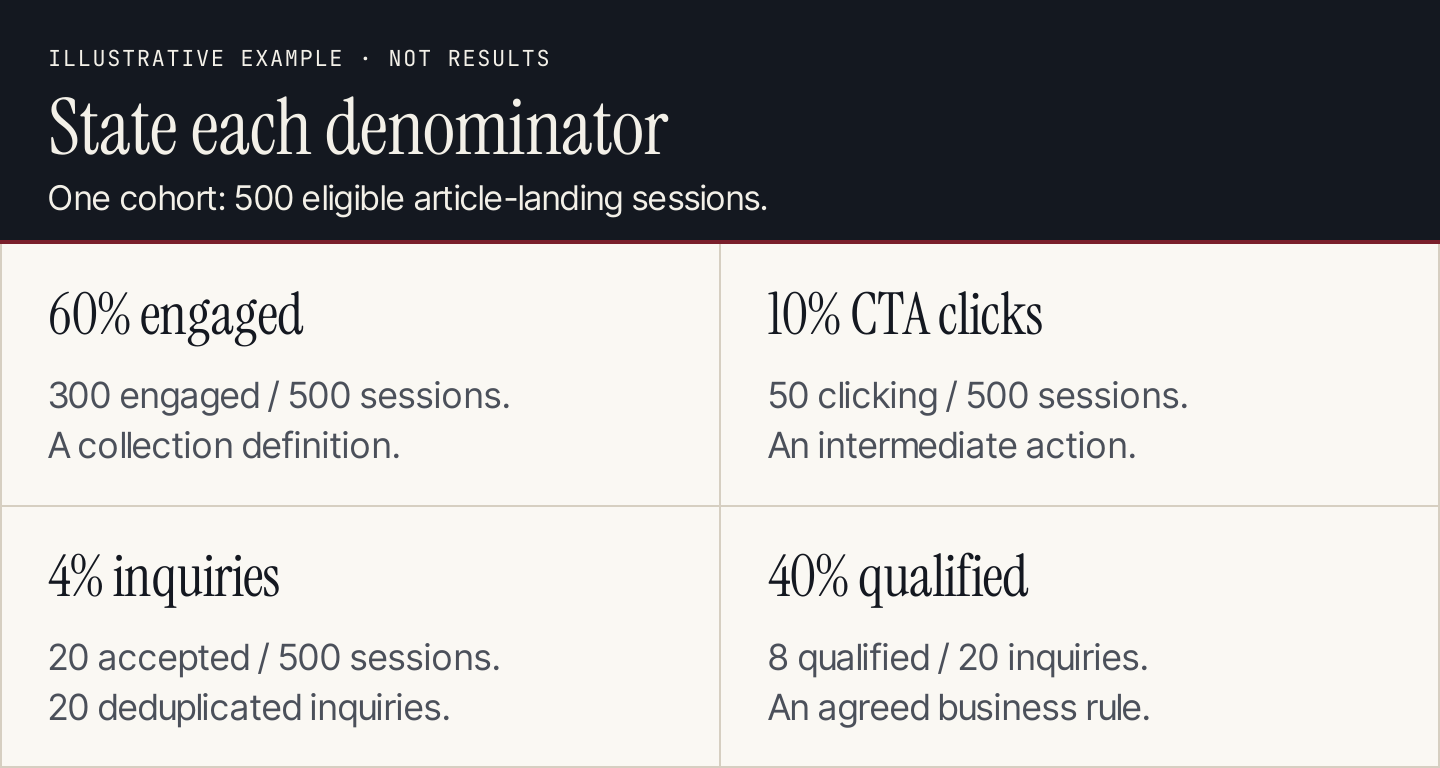
Illustrative figures use 500 eligible sessions and 20 accepted inquiries as their stated denominators.
These measures aren't necessarily sequential stages. A scroll event and a CTA click may occur in different orders, and some inquiries may come without the measured scroll threshold. Use a defined path analysis if you need to establish a sequence.
The report raises questions rather than proving a cause. If CTA clicks rise but qualification falls, inspect the expectations created by the article and destination. If visits fall after distribution changes, don't assume the writing became weaker. Compare the relevant context before choosing an edit.
Build a measurement plan before the next report
Select one primary outcome, one or two diagnostic measures, and an operating measure. For an educational resource, task completion might matter more than inquiries. For a buying guide, inquiry suitability may matter more than long reading time.
| Plan field | What to specify |
|---|---|
| Content role | The reader task and business purpose |
| Asset scope | URLs, content group, email, or video list |
| Reporting period | Dates and any qualification delay |
| Primary outcome | The action or state that represents success |
| Collection method | Platform report, event, application record, or CRM field |
| Numerator and denominator | Exact units and eligibility rules |
| Exclusions | Internal traffic, duplicates, automation, or unavailable coverage |
| QA check | How you'll confirm collection matches the real action |
| Comparison | Previous period or cohort with matching definitions |
| Owner | Person responsible for the measure and decision |
Test the measurement on the actual path. Confirm that an unsuccessful form attempt doesn't become an accepted inquiry, that repeated actions don't inflate session rates, and that a changed CTA still maps to the right label.
A reporting template that ends with a decision
Use one row per asset or coherent content group. Keep an evidence note for definitions and data gaps.
| Report field | What to write |
|---|---|
| Asset and role | Resource, audience, and intended task |
| Scope and period | Eligible cohort and dates |
| Primary result | Value, unit, and comparison |
| Diagnostic evidence | Two or three measures that help explain the result |
| Data confidence | Collection changes, missing coverage, qualification lag |
| Reader feedback | Relevant questions or difficulty reported |
| Proposed action | Maintain, improve, redistribute, investigate, or retire |
| Reason | Evidence connecting the action to the content's role |
| Owner and review | Person responsible and when the decision is revisited |
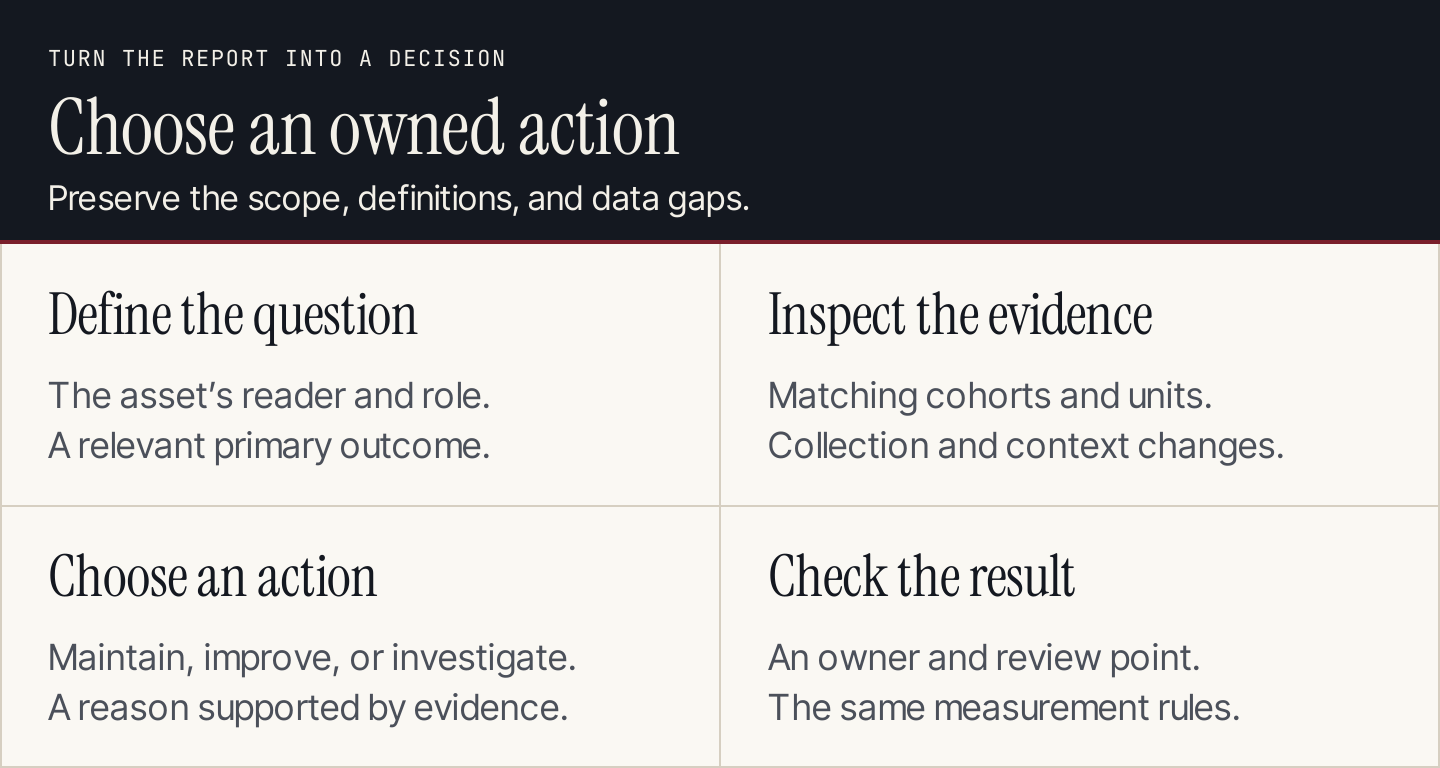
A useful report connects evidence to an owned action.
Avoid changing everything at once when you're trying to understand a problem. Make the proposed change specific, preserve the previous definition, and record what you'll check afterward. A distribution problem, measurement failure, and incomplete answer need different responses.
Common questions
How often should we review content performance?
Match the cadence to the decision and available data. Operational problems may need prompt attention; a small acquisition cohort or long qualification process needs more time. Keep the period consistent and don't turn daily fluctuations into repeated rewrites.
Which metric matters most?
The one closest to the asset's intended role that you can measure reliably. Views describe exposure. A meaningful action or verified task outcome usually answers a different, more useful question. Keep a small set of diagnostic measures to investigate the result.
Can content automation replace measurement?
No. Rankauto researches and writes blog articles, adds images and SEO fields, and saves drafts by default. Use your analytics and business records to assess their role. Production and performance measurement are separate responsibilities.