20 SEO Metrics and KPIs Your Business Should Track
Choose useful SEO metrics and KPIs. Compare search and website data, calculate rates correctly, and use a reporting template to decide what to improve.

Your SEO report should explain what changed, whether it matters to the business, and what the team will do next. A dashboard can show rising visits while inquiries decline. It can also show a lower click-through rate while bringing in more useful visitors.
Start with a small set of business outcomes, then use search and website metrics to investigate them. This guide covers 20 useful measures, shows where their definitions differ, and gives you a report template with worked calculations.
For a founder, the report should support a spending or scheduling decision. For a marketing team, it should guide improvements. For an agency, it should give the client a consistent account of results and limitations.
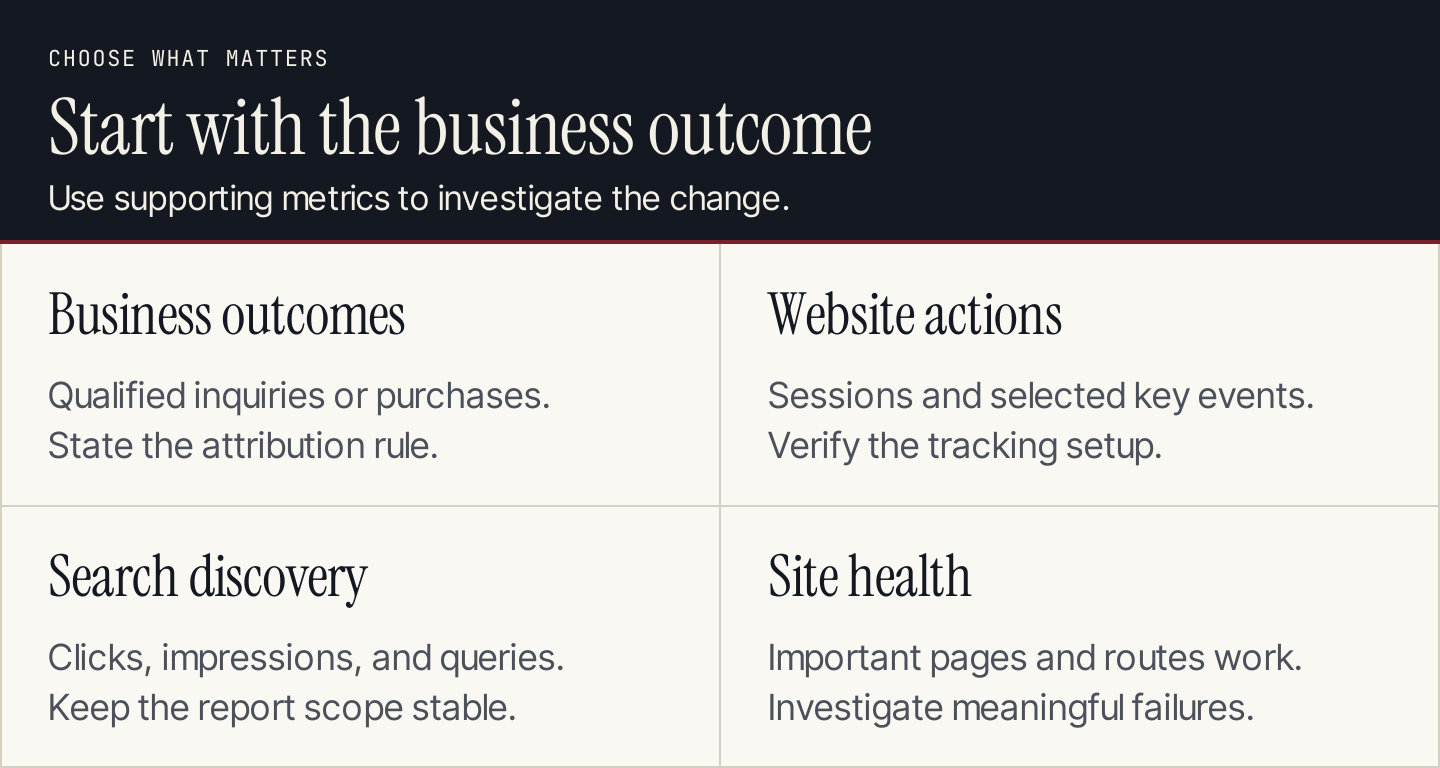
Choose the business outcome first, then use supporting measures to explain changes.
What is the difference between an SEO metric and a KPI?
A metric measures something. A key performance indicator, or KPI, is a measure selected to judge progress toward a particular goal.
Search clicks are a metric. Qualified inquiries from organic search could be a KPI for a service business. Purchases associated with organic sessions could be a KPI for an online store, provided the tracking and attribution rules are clear.
Choose three to five headline measures that your team can interpret and act on. Keep other measures available for investigation. A dashboard with 40 equally prominent numbers makes it harder to identify the decision.
Record a definition for each KPI:
Business goal:
Metric and exact definition:
Data source:
Page or audience scope:
Dates and comparison period:
Attribution or qualification rule:
Owner:
Known measurement limitations:
Decision this measure supports:
Avoid choosing a measure solely because it is easy to improve. Publishing more articles is work completed; it does not establish that the articles helped customers.
Start with the right sources
Google Search Console: search discovery
Search Console reports clicks, impressions, click-through rate, and average position. Use its Search results performance report to investigate which pages and searches contribute to visibility and visits.
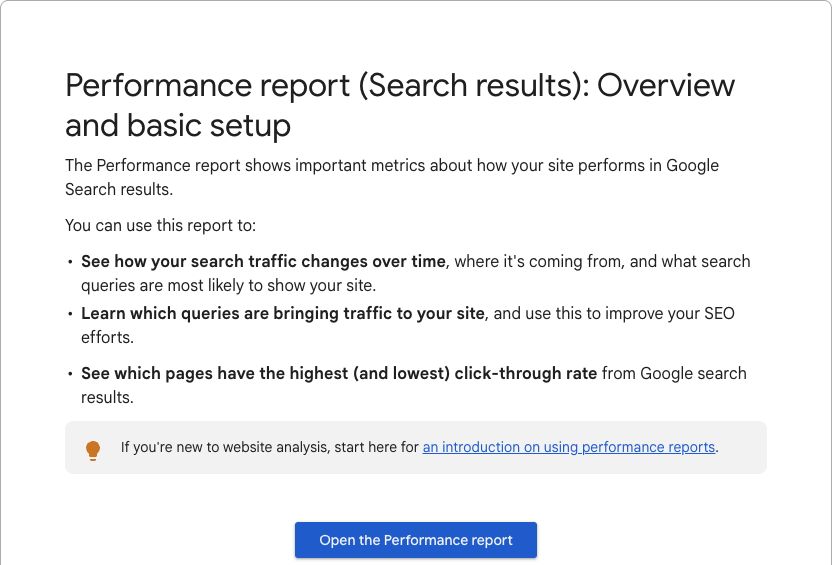
Search Console describes performance in Google Search. Source: Google Search Console Help.
Keep the search type, date range, country, and device settings with each export. A US mobile comparison answers a different question from a worldwide comparison across devices.
Google Analytics 4: acquired sessions and website actions
Use the GA4 Traffic acquisition report when examining sessions associated with organic search. Its dimensions describe sessions; the User acquisition report answers a different question about user acquisition.
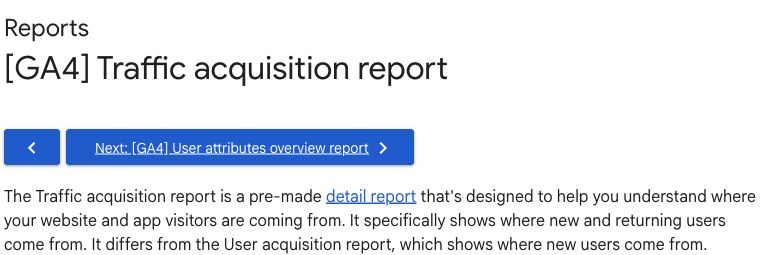
Use the report whose scope matches the question. Source: Google Analytics Help.
For all search sources, use the Organic Search channel in the relevant session dimension. A google / organic selection narrows the review to Google. Label the choice so the reader knows which traffic is included.
Sales records: qualified outcomes
Connect the reporting process to the team's actual qualification and purchase records. A form submission may be spam, a support request, a job inquiry, or a suitable lead.
Document how the team identifies a qualified inquiry and associates it with a source. Do not imply that an aggregate Search Console query identifies the individual who later became a customer.
20 SEO metrics to consider
You do not need all 20 as KPIs. Select the measures that support your business question and use the rest when investigating a change.
1. Qualified inquiries associated with organic search
Count inquiries that meet the team's written qualification criteria and source rule. Keep those criteria stable between reporting periods.
Show total submissions separately from qualified inquiries. If submissions rise but qualification falls, inspect the landing pages, offer clarity, and inquiry route before commissioning more traffic.
2. Purchases associated with organic search
For an online store, report completed purchases using a consistent tracking definition. Check that transaction measurement works and that duplicate or test transactions do not inflate the count.
An analytics purchase count and the order system may not agree exactly. Investigate the difference before presenting either as a complete business total.
3. Revenue associated with organic search
Use the agreed reporting source and attribution model. State whether the figure is analytics revenue, closed sales attributed in the customer system, or another defined measure.
Keep pipeline value separate from completed revenue. An open opportunity is a possible future sale, and its amount should not be added to closed revenue as if both were earned.
4. Organic acquisition cost
If you can identify the customers attributed to the channel, divide the defined SEO acquisition costs by that customer count. Include relevant production, agency, tool, and team costs in the cost definition.
Use a consistent time window and acknowledge the delay between discovery and purchase. A single month's spending and newly closed customers may describe different stages of the acquisition cycle.
5. Organic search sessions
Sessions describe website visits under the analytics tool's session rules. In GA4, inspect them with session-scoped source dimensions.
Use landing pages and device segments to locate changes. A site total can hide growth in an irrelevant article alongside a decline in a commercially important page.
6. Important website actions, called key events in GA4
Google defines key events as measured actions important to the business. Select actions such as a meaningful completed inquiry or purchase, with implementation appropriate to your website.
Document the event and its counting configuration. A generic click or scroll can be useful diagnostic information, but marking it important does not make it a qualified business outcome.
7. Session key event rate
This is the proportion of sessions with at least one key event, using the same scope for numerator and denominator. Google's Traffic acquisition metric definitions distinguish it from the count of key-event occurrences.
Use the event selection relevant to the question. An all-key-events rate can mix purchases with other actions and hide a change in the outcome you actually want.
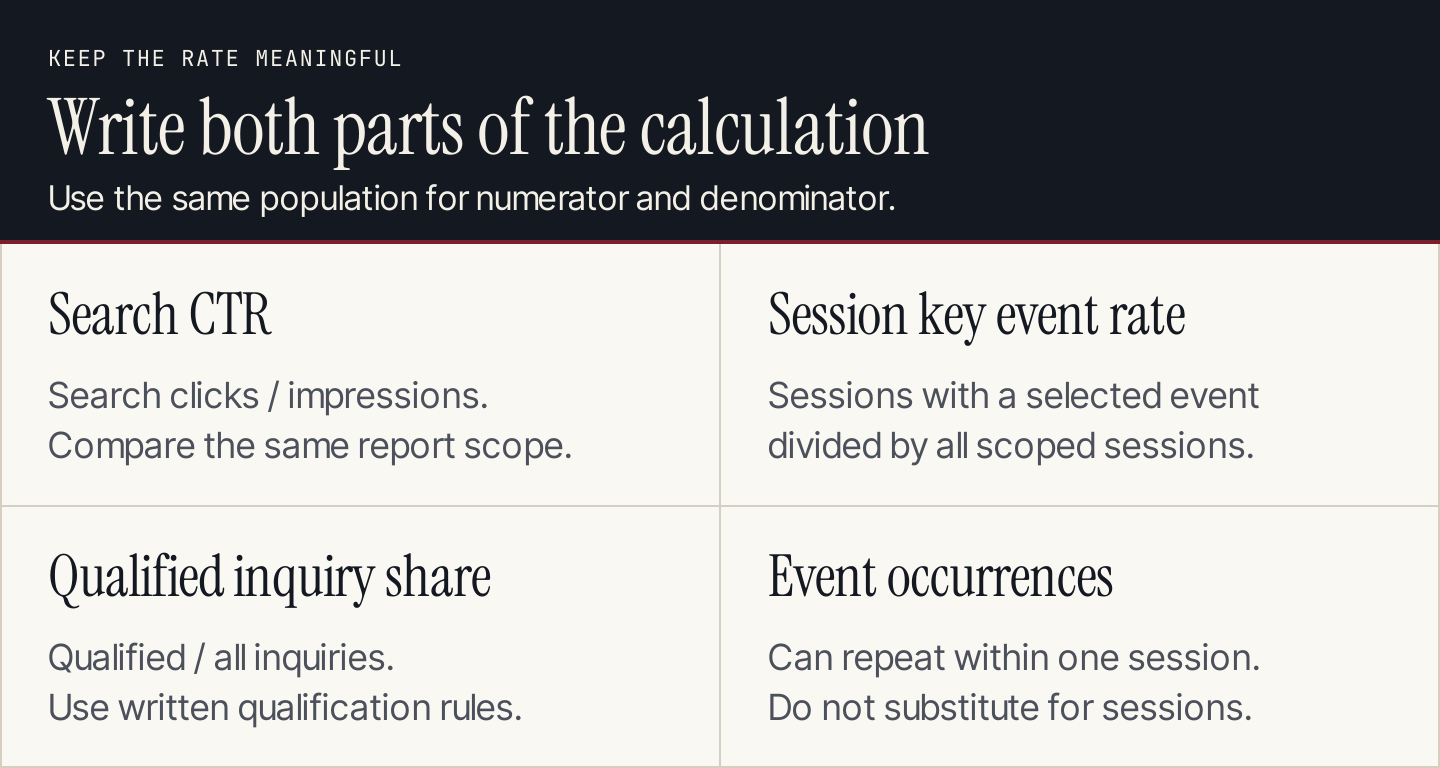
Write the numerator and denominator beside a rate so different measures are not confused.
Here is an illustrative calculation, not data from a business:
| Quantity | Example value |
|---|---|
| Organic sessions | 800 |
| Organic sessions with at least one selected key event | 32 |
| Recorded occurrences of that event in the same scope | 80 |
The session key event rate is 32 ÷ 800 × 100 = 4%. Dividing 80 by 800 gives 10 event occurrences per 100 sessions. It does not give the percentage of sessions that completed the action, because one session may contain repeated occurrences.
8. Google Search clicks
Clicks help you inspect visits generated from search results within the report's definitions. Compare a suitable page group and query family rather than assuming the site total represents one consistent audience.
When clicks change, inspect the relevant impressions, query mix, page purpose, and search conditions. The number alone does not identify a cause.
9. Google Search impressions
Impressions describe appearances in search under Google's counting rules. They help you investigate visibility, including searches that do not generate a click.
More impressions can mean a broader query mix. Check whether that new exposure fits the business before treating it as an improvement in customer acquisition.
10. Search click-through rate
CTR is clicks divided by impressions for the same scope. Use it to inspect a page or search segment, with the relevant position and query mix beside it.
There is no universal target that makes every page successful. A lower rate may accompany broader visibility; a higher rate may accompany a smaller, more familiar audience.
11. Average search position
Average position summarizes reported result positions. It is not a promise that everyone sees your page at that position, and it is not the ranking of every query on the site.
Use it to investigate comparable segments. If the query mix changes, the site-wide average can move even while important pages hold their positions.
12. Branded and nonbranded search performance
Separate searches containing the brand from other relevant searches. This helps distinguish discovery by unfamiliar audiences from demand by people who already know the business.
Google's dimensions documentation describes branded filtering and its availability limits. Check the classification and include important brand variations in any manual rule.
Brand searches can reflect campaigns, referrals, events, and other activity. Do not credit their growth entirely to SEO without supporting evidence.
13. Visibility across a defined keyword set
A rank tracker can summarize performance for a maintained list of relevant searches. Keep the keyword list, country, device, and calculation method with the report.
If you add easier keywords or change the provider, the score may improve without a comparable improvement in the original set. Report that methodology change explicitly.
14. Indexing of important intended pages
Review whether the pages meant to be discoverable are indexed, using the relevant site inventory and Google's Page indexing report.
The useful goal is appropriate coverage. Increasing the raw number of indexed URLs can include duplicates or pages your business does not need in search. Use the SEO audit checklist to investigate exceptions.
15. Core Web Vitals and important technical failures
Monitor problems that affect the pages customers need. Google's Core Web Vitals guidance covers loading, responsiveness, and visual stability.
Keep page availability and broken customer actions visible too. A serious failure on an important landing page should not disappear inside an otherwise improving site score.
16. Relevant incoming links and lost destinations
Use suitable backlink data to investigate useful external references, losses, and links pointing to broken pages. Record the provider and observation date.
Quality and destination fit matter to the investigation. A higher link count or a vendor's authority score does not establish a business outcome or guarantee rankings.
17. Qualified share of organic inquiries
Divide qualified inquiries by all inquiries associated with organic search, using the same scope and written qualification rules. This shows how suitable the incoming requests are, alongside their count.
Keep incomplete qualification visible. If the sales team has not reviewed every request, report the pending count rather than treating those inquiries as either qualified or rejected.
18. Pipeline associated with organic discovery
For a business with a longer sales cycle, inspect accepted opportunities linked to organic discovery under the agreed customer-record rule. Show the number and open value separately from closed sales.
State whether organic is the first recorded source, the primary source, or one of several recorded touches. Overlapping attribution views should not be added together as independent opportunities.
19. Engagement rate for relevant organic landing pages
GA4's engagement rate is the proportion of sessions classified as engaged. Use the relevant organic landing-page group when investigating the experience.
Check the engagement settings and measured actions. A short visit can still answer a simple question, while a long visit can reflect confusion. The measure needs context and does not independently establish content quality or sales value.
20. Relevant Business Profile interactions
For a local business, Google Business Profile performance includes applicable interactions such as website clicks, call-button clicks, and direction requests. A call-button click is not evidence that a call connected or became a qualified inquiry.
The profile report can include organic and advertising activity. Label its scope instead of presenting every interaction as an organic website conversion. Keep different interaction types separate when their business meanings differ.
Worked example: clicks rise while CTR falls
The following numbers are illustrative. They demonstrate how to interpret a report without inventing a case study or claiming a client's results.
| Measure | Earlier period | Later period | Observation |
|---|---|---|---|
| Search impressions | 10,000 | 15,000 | Up 50% |
| Search clicks | 400 | 450 | Up 12.5% |
| Search CTR | 4% | 3% | Down 1 percentage point |
Both periods can be correct: 400 divided by 10,000 is 4%, and 450 divided by 15,000 is 3%. The website received more clicks while a smaller share of its impressions produced a click.
The next question is whether the additional exposure came from useful searches. Review the query mix, page group, device, country, and position before rewriting titles. Then inspect the relevant website actions and qualified outcomes.
A lower aggregate CTR alone is insufficient evidence that the article introduction needs rewriting.
Why Search Console clicks and GA4 sessions do not match
They measure different things using different collection and processing rules. Google's data discrepancy guidance explains several reasons the reports can differ, including privacy, processing, time zones, and measurement through JavaScript.
Check that the page scope, dates, search sources, and source dimensions align as closely as the question requires. Then investigate tracking changes or unexpected gaps.
Do not multiply Search Console clicks by a GA4 session key event rate and label the result as actual inquiries. The denominators and collection rules differ.
Search Console also omits some queries, and page-level data commonly uses canonical URL aggregation. Its dimensions and data groupings explain these limitations. A sum of visible query rows should not be presented as every search that occurred.
Build a report that leads to a decision
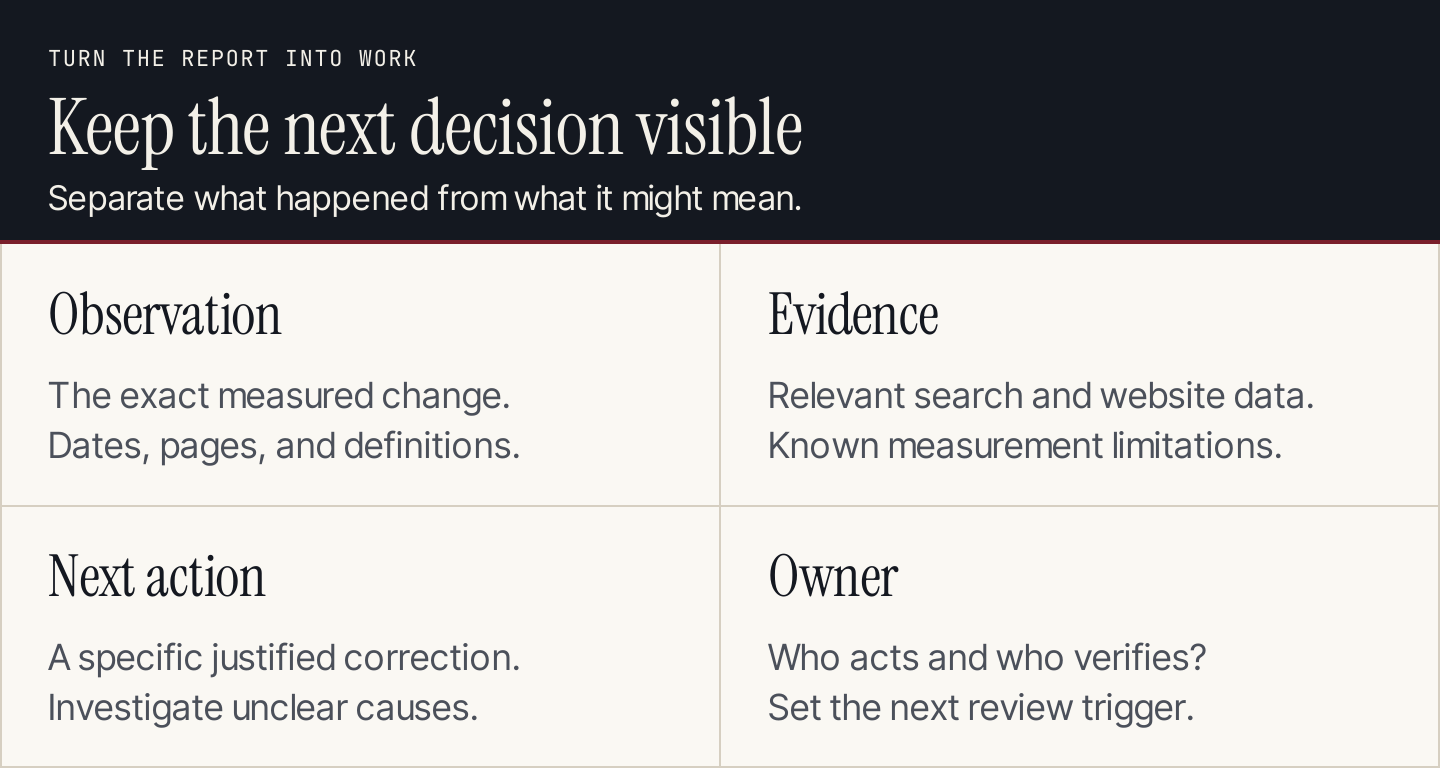
Keep the observation, interpretation, and proposed action separate in the report.
Use this monthly or quarterly template, choosing a period appropriate to the site's traffic and sales cycle:
| Report field | What to include |
|---|---|
| Business question | The decision this report supports |
| Headline outcome | The agreed KPI and exact comparison |
| Supporting search evidence | Relevant page and query groups, with filters |
| Supporting website evidence | Organic sessions and the selected measured actions |
| Interpretation | What the evidence suggests, with alternative explanations |
| Next action | A specific page, tracking, technical, or content task |
| Owner and review trigger | Who acts and when the team will inspect the result |
| Measurement notes | Definition changes, missing data, and attribution limits |
A useful update might say: “Qualified inquiries declined on the main service pages. Search clicks were stable in the same page group. We will inspect the form and qualification records before scheduling more articles.” This is an example of report wording, not a reported business result.
For agencies, agree on the definition sheet with the client before the first comparison. Keep it with the report so a new stakeholder can understand what the numbers include.
Track AI visibility separately when it matters
If AI discovery is relevant, keep sampled brand mentions, linked citations, and measurable referral visits as separate measures. A mention is not necessarily a link, and a link is not necessarily a visit.
Record the prompt set, platforms, dates, and sampling conditions. Changes in the sample can change the result even when the brand's underlying visibility has not changed. Our AI visibility tracking guide covers that review in more detail.
Rankauto does not track AI citations. Use a suitable visibility tool or a documented manual sample for that measurement, and keep it separate from your content production report.
Turn the findings into a content plan
Use the report to select work your team can justify. Improve a suitable page with an incomplete answer. Refresh changed facts. Investigate an access failure. Write a new article when a distinct, relevant customer task lacks coverage.
With Rankauto, you can research keywords and prepare blog drafts in your brand voice. Keep your KPI definitions and page map beside the plan, then review drafts before publishing. Article output is an operational measure; the later search and business outcomes need their own evaluation.
Common questions
What should a small business track first?
Start with a meaningful qualified outcome, organic sessions, and relevant search clicks. Add supporting measures when they help diagnose a change. Confirm the tracking definitions before judging performance.
Is average position a good KPI?
It can support a visibility investigation, especially within a consistent segment. It rarely answers the business question by itself. Pair it with the relevant audience, pages, and outcomes.
How often should I report SEO results?
Use a cadence suited to traffic, seasonality, and the sales cycle. Check important failures promptly, but give low-volume outcome comparisons enough context to be interpretable.
Can more traffic mean worse performance?
Yes. More visits can come from an audience your business cannot serve. Inspect qualified outcomes and page relevance before increasing production around that traffic.