AI Visibility Tracking: Set Up a Repeatable Baseline

AI visibility tracking records how a brand or website appears in sampled AI answers. A useful baseline tells you which questions were checked, which platforms produced the answers, what appeared, and how the measurement was calculated.
That is more valuable than a score with an unclear denominator. A brand mention, a linked citation, an impression, and a customer visit describe different events. Keep those events separate so your report can support a decision.
This guide provides a practical setup for a small business, marketing team, or agency: choose questions, define the checks, record the evidence, and connect the findings to actions.
What should you track?
Start with the question the business needs answered.
| Business question | Measure to record | What it cannot establish alone |
|---|---|---|
| Does our brand appear in these answers? | Brand mentions in a defined answer sample | Total audience reach |
| Do answers direct readers to our website as a source? | Linked citations to verified URLs | That anyone followed the link |
| Are we recommended for the intended use case? | Explicit recommendations, with context | Customer preference across the market |
| Is the information about us accurate? | Checked facts, errors, and outdated descriptions | Whether every unseen answer is accurate |
| Does AI discovery bring useful visits? | Observed referral sessions and agreed business events | All AI influence on the customer journey |
A mention should be recorded even when there is no link. A citation should be recorded even when the answer never names the brand. Count an explicit recommendation separately: an answer can mention a product while warning that it does not fit the requested situation.
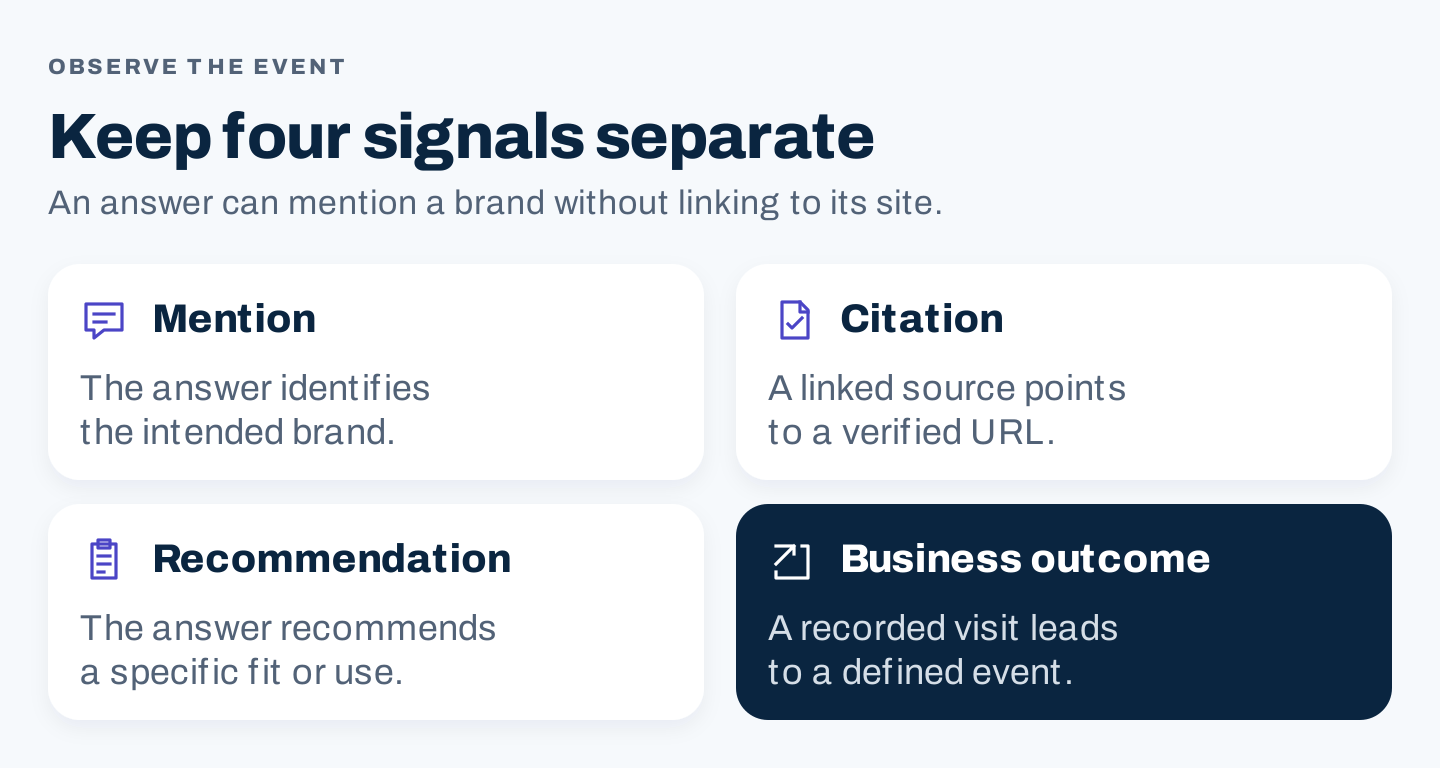
Original measurement framework. Record the event that occurred before combining results into a report.
Also decide how you will handle ambiguous names. A generic word in an answer may resemble a company name without referring to that company. Require enough context to identify the entity, and keep disputed cases available for review.
Step 1: Build questions around actual buyer decisions
Collect questions from sales conversations, support tickets, site-search queries, customer interviews, and keyword research. Use information your team is authorized to handle; a tracking service does not need private customer details to represent a common purchasing constraint.
Group the questions into tasks such as:
- Understanding the problem or category.
- Comparing approaches or products.
- Checking compatibility, pricing structure, or implementation requirements.
- Choosing a provider for a specific situation.
- Learning how to use or maintain an existing purchase.
Avoid a panel consisting entirely of “best” questions. It may overlook important buying conditions, and it can make the report look strong for a task that your customers rarely perform.
For a real public context, consider a business that sells website software. A meaningful comparison question might include the team’s size, current CMS, review process, and publishing needs. Those conditions give the answer a job to complete. They are more useful than adding dozens of near-identical synonyms to an unsupported generic prompt.
Create two sets:
A fixed baseline set. Keep these questions unchanged for the comparison period. It establishes continuity.
An exploratory set. Add new questions here when research reveals another use case. Review them separately until you deliberately revise the baseline.
There is no universal correct panel size. A small team might start with 12 questions across four decision tasks. That is a suggested manageable pilot, not a statistically representative sample of everyone using AI.
Step 2: Define the collection conditions
Record the actual platform, product mode, language, location setting where available, date, and conversation conditions. A browser product and an API can provide different experiences; do not assume an API response reproduces a consumer interface.
For a US English baseline, use consistent US settings where the product supports them. Note where location cannot be controlled. Start a fresh conversation for each baseline check unless a defined multi-turn scenario is part of the test.
Save the exact question. Changing it from “which platform suits a two-person team?” to “which platform is best?” changes the task, even if both prompts concern the same category.
A proposed pilot schedule is two platforms, 12 questions, and three repetitions per question in a reporting cycle. That produces 72 scheduled checks. The schedule is an operational starting point; it does not produce a confidence interval or represent all users.
Record collection failures separately from completed answers. A timeout, access error, or interrupted response is not evidence that the brand was absent.
Step 3: Understand what your tracking tool samples
Two tools can disagree while both accurately describe their own datasets.
Ahrefs Brand Radar distinguishes a broad AI visibility index from custom prompt tracking. Its public page explains the different purposes: broad discovery and competitor context versus a controlled set of questions. Vendor estimates of AI impressions are modeled measures, rather than direct observations of every human exposure.
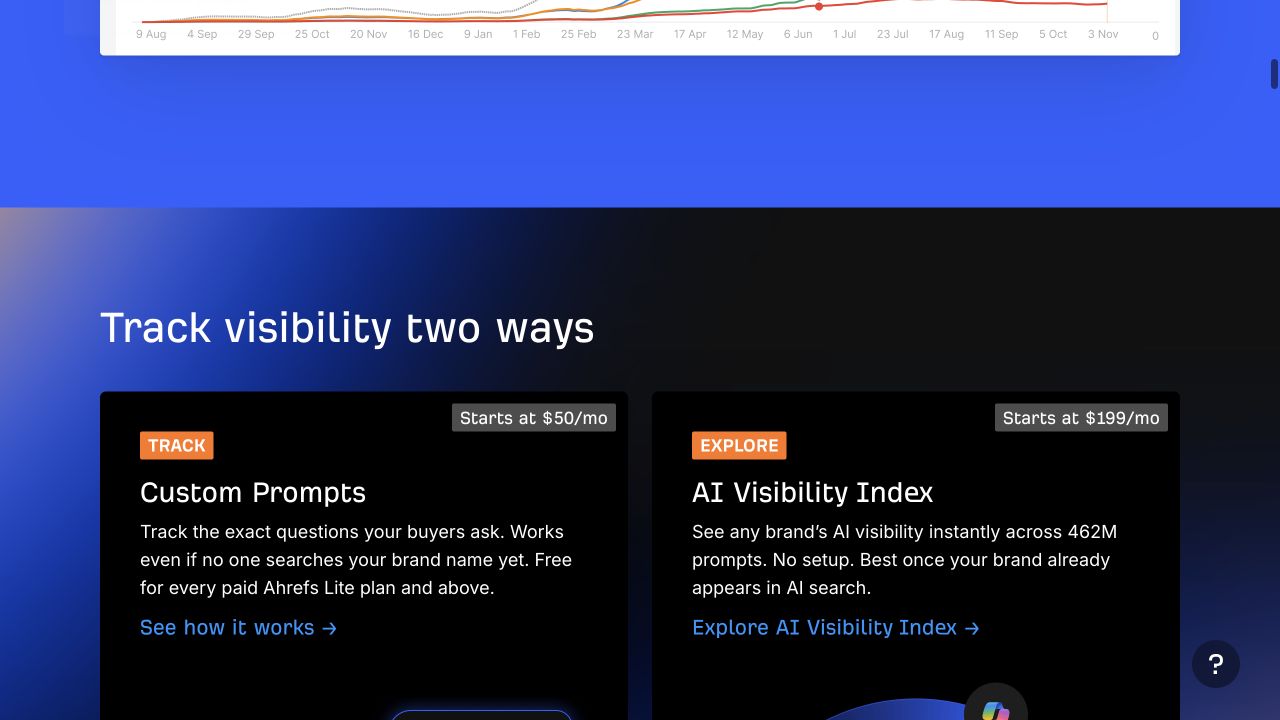
The public Brand Radar explanation, captured October 8, 2026. It illustrates two sampling approaches; no authenticated account report or campaign result is shown.
Before buying a tool or accepting its score, ask:
| Question | Why the answer matters |
|---|---|
| Where do the prompts come from? | Your panel may differ from a keyword-derived vendor index |
| Can we inspect the exact answer and source URLs? | A summary score needs supporting evidence |
| Which platforms and modes are checked? | Coverage may omit an important customer surface |
| How often are checks repeated? | One snapshot can hide variation |
| What counts as a mention, citation, or recommendation? | Definitions determine the numerator |
| What happens to missing or failed checks? | Dropped observations can make a rate look better |
| Can we export the raw records and panel history? | You need continuity and an audit trail |
Do not combine two vendor visibility scores into one average unless you can reconcile their definitions, samples, and calculation methods. Even a shared percentage label does not establish a shared measure.
Step 4: Use a log that preserves the evidence
One row should represent one check, rather than one topic’s latest summary. Keep the underlying answer or a permitted evidence capture so a reviewer can confirm the classification.
Check ID:
Panel version and question ID:
Exact question:
Platform and actual mode:
Date, time, language, and location conditions:
Fresh conversation or defined prior context:
Status: completed / no answer / collection failure
Brand mentioned: yes / no / ambiguous
Own-domain citation: yes / no
Exact cited URLs:
Explicit recommendation: yes / no / conditional
Fact check: accurate / incorrect / incomplete / not applicable
Evidence location:
Reviewer and next action:
“No answer” means the product completed the attempt without providing an evaluable answer. “Collection failure” means you could not complete the observation. Keep both visible, and explain their treatment in the report.
For ambiguous recommendations, record the sentence and its condition. “Consider this for a small team, but choose another option for complex governance” should not be flattened into an unconditional endorsement.
Step 5: Calculate rates with named denominators
Here is an illustrative arithmetic exercise, not a real campaign or tracking result.
Suppose a panel schedules 12 checks. Ten return evaluable answers, one returns no answer, and one fails during collection. Of the ten evaluable answers, four mention the brand, two cite its website, and one explicitly recommends it.
| Measure | Calculation | Illustrative result |
|---|---|---|
| Evaluable-answer completion | 10 ÷ 12 scheduled checks | 83.3% |
| Mention rate among evaluable answers | 4 ÷ 10 | 40% |
| Own-domain citation rate among evaluable answers | 2 ÷ 10 | 20% |
| Recommendation rate among evaluable answers | 1 ÷ 10 | 10% |
Also report the no-answer and collection-failure counts. Otherwise, a rising mention rate could simply reflect the disappearance of difficult checks from the denominator.
A repeatable competitor measure is presence share: count at most one presence per tracked brand in each evaluable answer, add those presence events, and calculate each brand’s portion of that total. If an illustrative sample contains four presences for Brand A, six for Brand B, and two for Brand C, Brand A’s presence share is 4 ÷ 12, or 33.3%.
This is an original worksheet definition. It is not a universal vendor “share of voice” formula. It excludes brands outside the selected set, and an answer may contain several tracked brands. Label it precisely and keep the competitor set unchanged for a comparison.
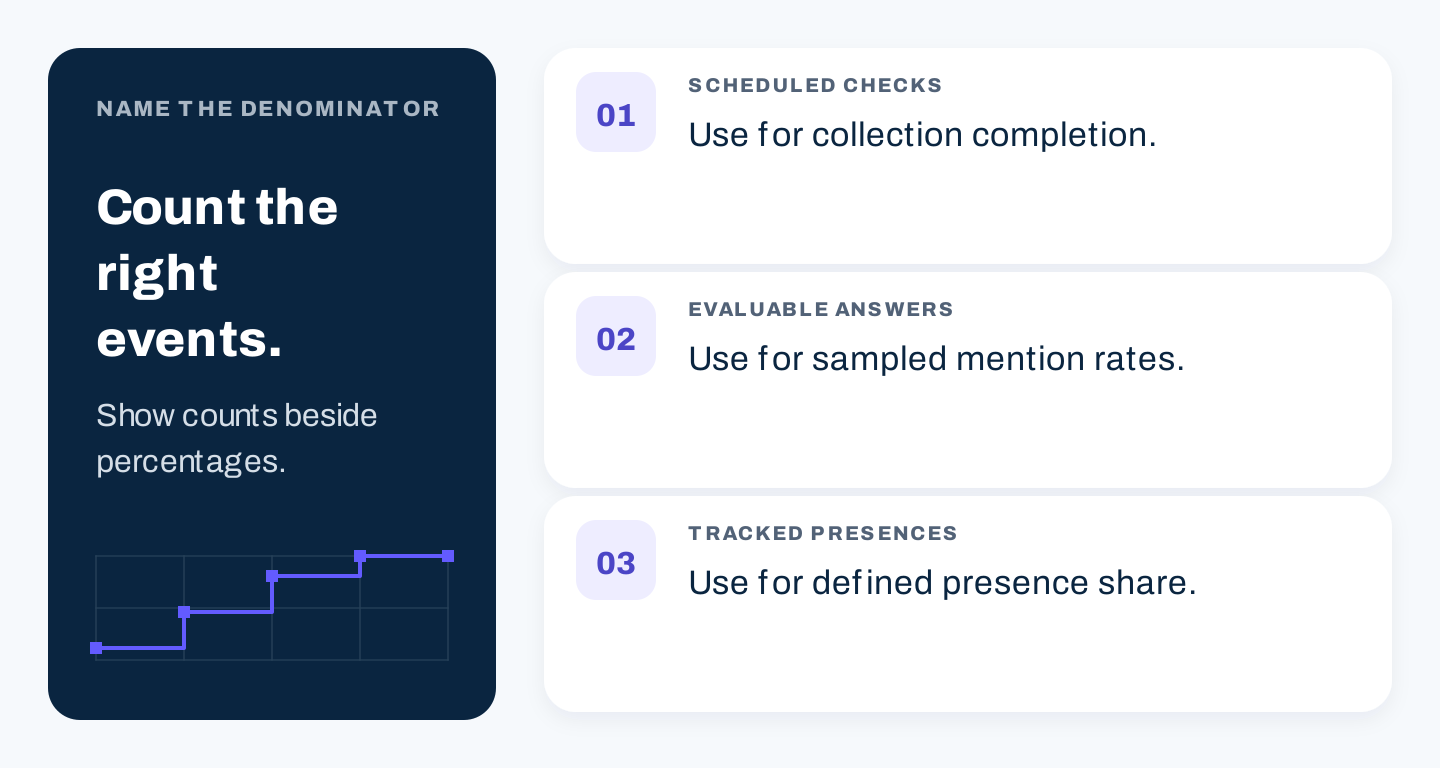
Original reporting checklist. These denominators answer different questions and should not be exchanged.
Show counts beside percentages, especially for a small panel. Four out of ten answers is easier to assess than “40% visibility” without context.
Step 6: Add Google’s own AI reporting where available
Google’s generative AI performance report for Search documents impressions for AI Overviews and AI Mode. It supports dimensions including page, country, date, and device. This is a different measurement source from a repeated prompt panel.
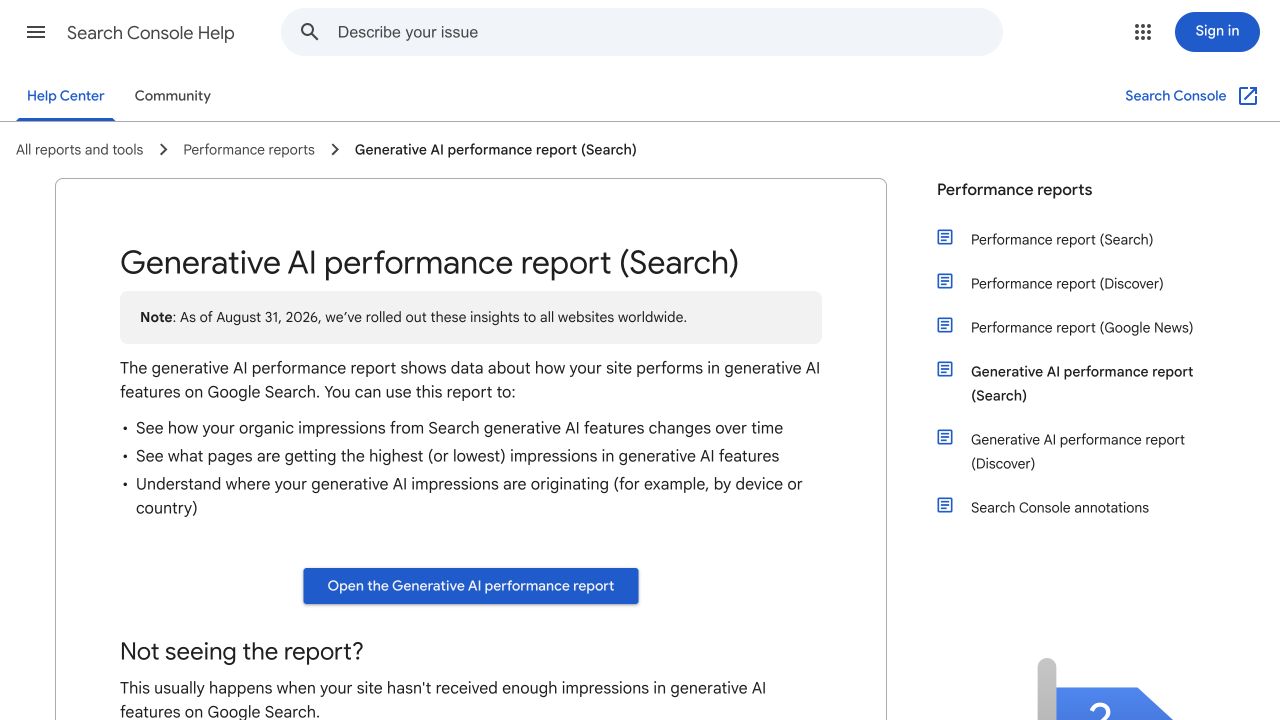
Public help documentation, captured October 8, 2026. This screenshot is not private Search Console data for a business.
An absent report does not necessarily mean zero AI visibility: availability and sufficient impressions matter. The documentation also distinguishes property aggregation from page aggregation and identifies preliminary data. Preserve those qualifications when exporting or comparing figures.
Use the report to answer questions within its documented scope. Do not equate its impressions with sessions or assume that a page-level table can simply be summed to reproduce a differently aggregated chart.
Step 7: Connect referrals to useful actions
Use analytics to investigate visits that carry an identifiable AI referral source. In GA4, the Traffic acquisition report provides session-level acquisition dimensions, including source and medium, alongside session and event measures.
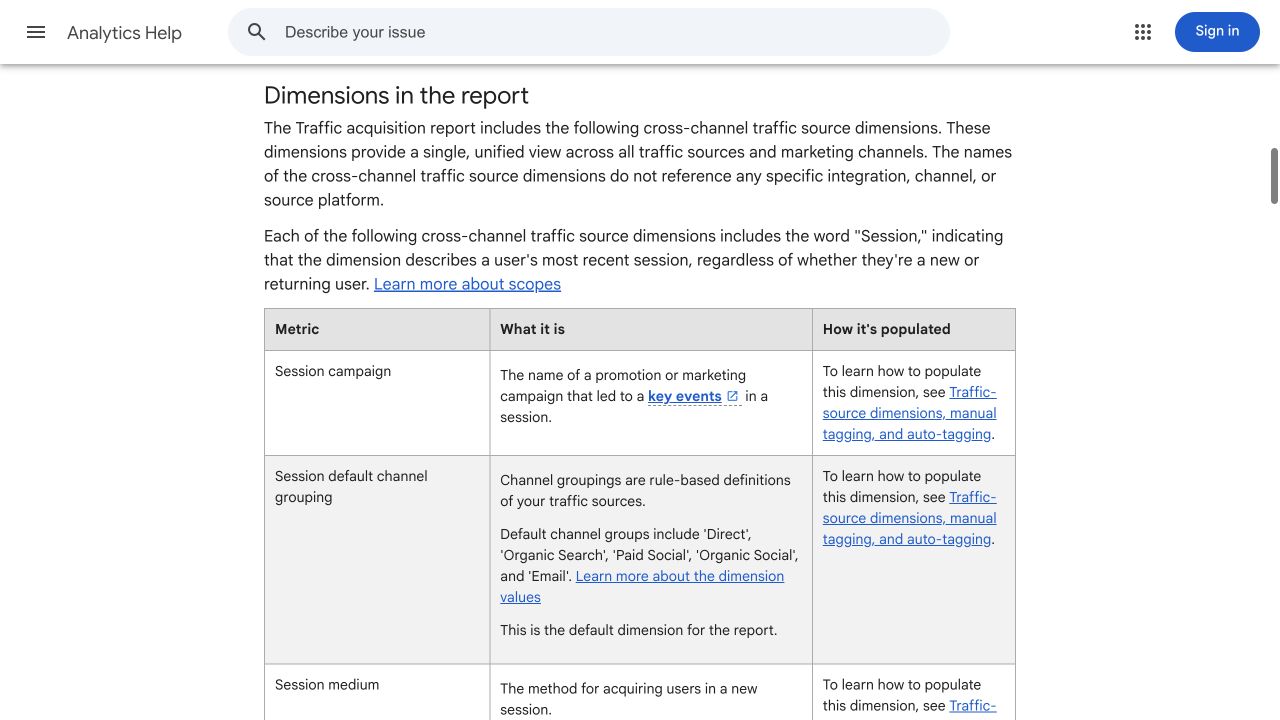
Public GA4 documentation, captured October 8, 2026. It explains report fields; no private traffic figures or revenue results are implied.
Start by inspecting the actual source/medium values recorded in your property. Maintain a checked list of the sources you intend to group, then review landing pages and the business events your team has defined.
Do not classify all direct traffic as AI traffic. A person may see an answer and return later without a referral, but analytics cannot establish that explanation for every unattributed session.
For agencies, keep each client’s event definition visible. A purchase, a qualified enquiry, and an unreviewed form submission are different outcomes. A combined dashboard can be convenient, but the underlying definitions still need to travel with the numbers.
Turn findings into a weekly action report
Use a one-page report with four blocks:
- Collection health: scheduled and completed checks, failures, panel version, platforms, and known changes.
- Observed presence: mentions, citations, recommendations, and accuracy findings, split by task and platform.
- Website outcomes: identifiable referral sessions and agreed events, with attribution limits.
- Next actions: the specific evidence, owner, change, and date for checking it again.
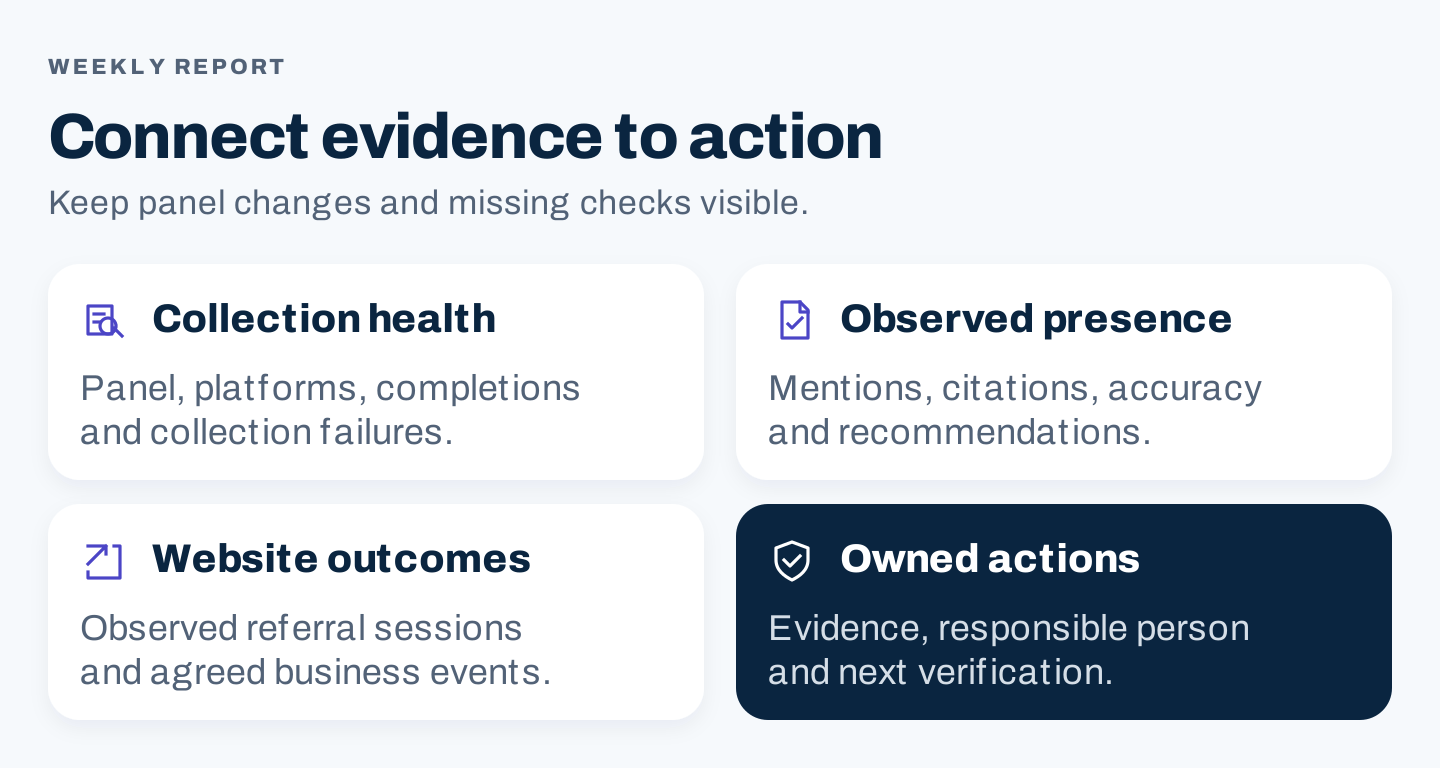
Original report structure. The action block should explain what the team will investigate or change and how it will check the result.
Use this diagnosis table to avoid acting on the score alone:
| Observation | Useful next investigation |
|---|---|
| Citations fall on one platform | Check collection health, exact answers, changed sources, and affected tasks |
| Brand appears but information is wrong | Verify the cited source and correct the maintained source information |
| A competitor is recommended for a specific condition | Compare actual offer fit and whether your page explains that condition |
| Referral sessions rise but useful events do not | Inspect landing-page relevance, event tracking, and the next action |
| The score rises after adding easier prompts | Report the panel change; compare the unchanged subset separately |
A before-and-after difference is an observation, not proof that your edit caused it. Record other changes such as platform updates, campaign activity, competitor changes, and measurement changes.
An optional AI prompt for reviewing the log
AI can help organize records after you collect them. Keep its task bounded to the evidence.
Review this AI visibility log using only the supplied records.

First list the panel versions, platforms, statuses, and missing fields.
Calculate mention and citation rates only for evaluable answers,
showing the numerator and denominator. Report no-answer and failed
checks separately. Do not replace missing values with zero.

Group confirmed errors and recurring gaps by buyer task.
For every proposed action, cite the check IDs that support it.
Separate observed changes from possible explanations.
Do not invent answers, citations, search volume, or causal results.
Check the arithmetic and a sample of the classifications yourself. The log remains the evidence; the AI summary is a way to inspect it.
A good baseline helps a team say exactly what changed and what remains unknown. Keep the questions stable, the raw observations available, and the business outcomes separate. That gives AI visibility tracking a useful role in marketing decisions.